From 2010-2019, an average of 13 million guns were sold legally in the U.S. each year. In 2020 and 2021, annual gun sales sharply increased to 20 million. While the U.S. does import millions of weapons each year, a large amount of firearms sold in the country were produced domestically. Let’s dig into the data behind the multi-billion dollar gun manufacturing industry in America.
Gun Manufacturing in the United States
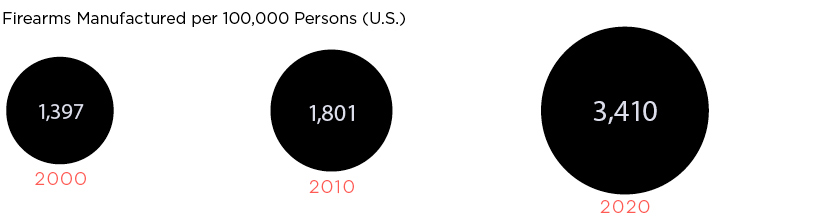
According to a recent report from the Bureau of Alcohol, Tobacco, Firearms and Explosives (ATF), the U.S. has produced nearly 170 million firearms over the past three decades, with production increasing sharply in recent years.
America’s gunmakers produce a wide variety of firearms, but they’re generally grouped into five categories; pistols, rifles, shotguns, revolvers, and everything else. Below is a breakdown of firearms manufactured in the country over the past 30 years, by type: Pistols (36%) and rifles (35%) are the dominant categories, and over time, the former has become the most commonly produced firearm type. In 2001, pistols accounted for 21% of firearms produced. Today, nearly half of all firearms produced are pistols.
Who is Producing America’s Firearms?
There are a wide variety of firearm manufacturing companies in the U.S., but production is dominated by a few key players. Here are the top 10 gunmakers in America, which collectively make up 70% of production: One-third of production comes from two publicly-traded parent companies: Smith & Wesson (NASDAQ: SWBI), and Sturm, Ruger & Co. (NYSE: RGR) Some of these players are especially dominant within certain types of firearms. For example:
58% of pistols were made by Smith & Wesson, Ruger, and SIG SAUER (2008–2018) 45% of rifles were made by Remington*, Ruger, and Smith & Wesson (2008–2018)
*In 2020, Remington filed for Chapter 11 bankruptcy protection, and its assets were divided and sold to various buyers. The Remington brand name is now owned by Vista Outdoor (NYSE: VSTO)
The Geography of Gun Manufacturing
Companies that manufacture guns hold a Type 07 license from the ATF. As of 2020, there are more than 16,000 Type 07 licensees across the United States. Below is a state-level look at where the country’s licensees are located: These manufacturers are located all around the country, so these numbers are somewhat reflective of population. Unsurprisingly, large states like Texas and Florida have the most licensees. Sorting by the number of licensees per 100,000 people offers a different point of view. By this measure, Wyoming, Montana, and Idaho come out on top. If recent sales and production trends are any indication, these numbers may only continue to grow. on Last year, stock and bond returns tumbled after the Federal Reserve hiked interest rates at the fastest speed in 40 years. It was the first time in decades that both asset classes posted negative annual investment returns in tandem. Over four decades, this has happened 2.4% of the time across any 12-month rolling period. To look at how various stock and bond asset allocations have performed over history—and their broader correlations—the above graphic charts their best, worst, and average returns, using data from Vanguard.
How Has Asset Allocation Impacted Returns?
Based on data between 1926 and 2019, the table below looks at the spectrum of market returns of different asset allocations:
We can see that a portfolio made entirely of stocks returned 10.3% on average, the highest across all asset allocations. Of course, this came with wider return variance, hitting an annual low of -43% and a high of 54%.
A traditional 60/40 portfolio—which has lost its luster in recent years as low interest rates have led to lower bond returns—saw an average historical return of 8.8%. As interest rates have climbed in recent years, this may widen its appeal once again as bond returns may rise.
Meanwhile, a 100% bond portfolio averaged 5.3% in annual returns over the period. Bonds typically serve as a hedge against portfolio losses thanks to their typically negative historical correlation to stocks.
A Closer Look at Historical Correlations
To understand how 2022 was an outlier in terms of asset correlations we can look at the graphic below:
The last time stocks and bonds moved together in a negative direction was in 1969. At the time, inflation was accelerating and the Fed was hiking interest rates to cool rising costs. In fact, historically, when inflation surges, stocks and bonds have often moved in similar directions. Underscoring this divergence is real interest rate volatility. When real interest rates are a driving force in the market, as we have seen in the last year, it hurts both stock and bond returns. This is because higher interest rates can reduce the future cash flows of these investments. Adding another layer is the level of risk appetite among investors. When the economic outlook is uncertain and interest rate volatility is high, investors are more likely to take risk off their portfolios and demand higher returns for taking on higher risk. This can push down equity and bond prices. On the other hand, if the economic outlook is positive, investors may be willing to take on more risk, in turn potentially boosting equity prices.
Current Investment Returns in Context
Today, financial markets are seeing sharp swings as the ripple effects of higher interest rates are sinking in. For investors, historical data provides insight on long-term asset allocation trends. Over the last century, cycles of high interest rates have come and gone. Both equity and bond investment returns have been resilient for investors who stay the course.