In times past, that media ecosystem would include various mass media outlets, from newspapers to cable TV networks. Today, the internet and social media platforms have greatly expanded the scope and reach of communication within society. Of course, journalism plays a key role within that ecosystem. High quality journalism and the unprecedented transparency of social media keeps power structures in check—and sometimes, these forces can drive genuine societal change. Reporters bring us news from the front lines of conflict, and uncover hard truths through investigative journalism. That said, these positive impacts are sometimes overshadowed by harmful practices and negative externalities occurring in the media ecosystem. The graphic above is an attempt to catalog problems within the media ecosystem as a basis for discussion. Many of the problems are easy to understand once they’re identified. However, in some cases, there is an interplay between these issues that is worth digging into. Below are a few of those instances. Editor’s note: For a full list of sources, please go to the end of this article. If we missed a problem, let us know!
Explicit Bias vs. Implicit Bias
Broadly speaking, bias in media breaks down into two types: explicit and implicit. Publishers with explicit biases will overtly dictate the types of stories that are covered in their publications and control the framing of those stories. They usually have a political or ideological leaning, and these outlets will use narrative fallacies or false balance in an effort to push their own agenda. Unintentional filtering or skewing of information is referred to as implicit bias, and this can manifest in a few different ways. For example, a publication may turn a blind eye to a topic or issue because it would paint an advertiser in a bad light. These are called no fly zones, and given the financial struggles of the news industry, these no fly zones are becoming increasingly treacherous territory.
Misinformation vs. Disinformation
Both of these terms imply that information being shared is not factually sound. The key difference is that misinformation is unintentional, and disinformation is deliberately created to deceive people. Fake news stories, and concepts like deepfakes, fall into the latter category. We broke down the entire spectrum of fake news and how to spot it, in a previous infographic.
Simplify, Simplify
Mass media and social feeds are the ultimate Darwinistic scenario for ideas. Through social media, stories are shared widely by many participants, and the most compelling framing usually wins out. More often than not, it’s the pithy, provocative posts that spread the furthest. This process strips context away from an idea, potentially warping its meaning. Video clips shared on social platforms are a prime example of context stripping in action. An (often shocking) event occurs, and it generates a massive amount of discussion despite the complete lack of context. This unintentionally encourages viewers to stereotype the persons in the video and bring our own preconceived ideas to the table to help fill in the gaps. Members of the media are also looking for punchy story angles to capture attention and prove the point they’re making in an article. This can lead to cherrypicking facts and ideas. Cherrypicking is especially problematic because the facts are often correct, so they make sense at face value, however, they lack important context. Simplified models of the world make for compelling narratives, like good-vs-evil, but situations are often far more complex than what meets the eye.
The News Media Squeeze
It’s no secret that journalism is facing lean times. Newsrooms are operating with much smaller teams and budgets, and one result is ‘churnalism’. This term refers to the practice of publishing articles directly from wire services and public relations releases. Churnalism not only replaces more rigorous forms of reporting—but also acts as an avenue for advertising and propaganda that is harder to distinguish from the news. The increased sense of urgency to drive revenue is causing other problems as well. High-quality content is increasingly being hidden behind paywalls. The end result is a two-tiered system, with subscribers receiving thoughtful, high-quality news, and everyone else accessing shallow or sensationalized content. That everyone else isn’t just people with lower incomes, it also largely includes younger people. The average age of today’s paid news subscriber is 50 years old, raising questions about the future of the subscription business model. For outlets that rely on advertising, desperate times have called for desperate measures. User experience has taken a backseat to ad impressions, with ad clutter (e.g. auto-play videos, pop-ups, and prompts) interrupting content at every turn. Meanwhile, in the background, third-party trackers are still watching your every digital move, despite all the privacy opt-in prompts.
How Can We Fix the Problems with Media?
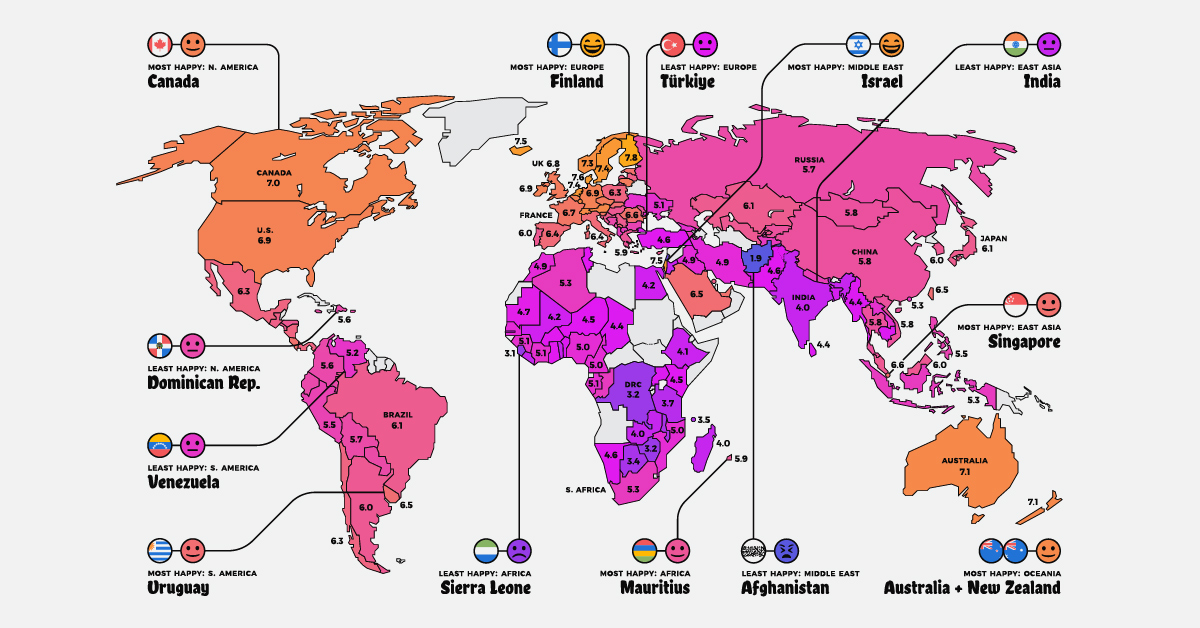
With great influence comes great responsibility. There is no easy fix to the issues that plague news and social media. But the first step is identifying these issues, and talking about them. The more media literate we collectively become, the better equipped we will be to reform these broken systems, and push for accuracy and transparency in the communication channels that bind society together. Veils of Distortion: How the News Media Warps our Minds by John Zada Hate Inc. by Matt Taibbi Manufacturing Consent by Edward S. Herman and Noam Chomsky The Truth Matters: A Citizen’s Guide to Separating Facts from Lies and Stopping Fake News in its Tracks by Bruce Bartlett Active Measures: The Secret History of Disinformation and Political Warfare by Thomas Rid The Twittering Machine by Richard Seymour After the Fact by Nathan Bomey Ten Arguments for Deleting Your Social Media Accounts Right Now by Jaron Lanier Zucked by Roger McNamee Antisocial: Online Extremists, Techno-Utopians, and the Highjacking of the American Conversation by Andrew Marantz Social media is broken by Sara Brown The U.S. Media’s Problems Are Much Bigger than Fake News and Filter Bubbles by Bharat N. Anand What’s Wrong With the News? by FAIR Is the Media Doomed? by Politico The Implied Truth Effect by Gordon Pennycook, Adam Bear, Evan T. Collins, David G. Rand on Are wealth and prosperity legitimate measures of happiness? How about safety and health outcomes? In the West, we view democracy as a key component to happiness, yet there are countries under authoritarian rule that score high in the Happiness Index. Questions like these make “ranking happiness” a particularly challenging puzzle, but also one worth pursuing. If policymakers have a clearer picture of what conditions can foster happiness, they can enact policies that can improve the lives of people living their jurisdictions. The map above is a global snapshot of life satisfaction around the world. It utilizes the World Happiness Report—an annual survey of how satisfied citizens are worldwide—to map out the world’s happiest and least happy countries. To create the index the map is based on, researchers simply asked people how satisfied they are with their lives. Scores were assigned using these self-reported answers from people living within various countries, as well as quality of life factors. While there may be no perfect measure of happiness around the world, the report is a robust and transparent attempt to understand happiness at the global level. For more detailed notes on the report’s methodology and more, we recommend viewing the info box at the end of this article. Now, let’s look at the world’s happiest countries in 2023.
Global Happiness, by Country
Global happiness currently averages out to 5.5 out of 10, a decrease of 0.1 from last year. Below is a look at every country’s score: Note: Scores have been rounded to the first decimal place. European countries make up the bulk of the top 10, with Israel (#4) and New Zealand (#10) also making it into the top ranks. Finland sits at the very top of the ranking for the sixth year in a row. Now let’s look at the world’s happiest countries on a more regional basis.
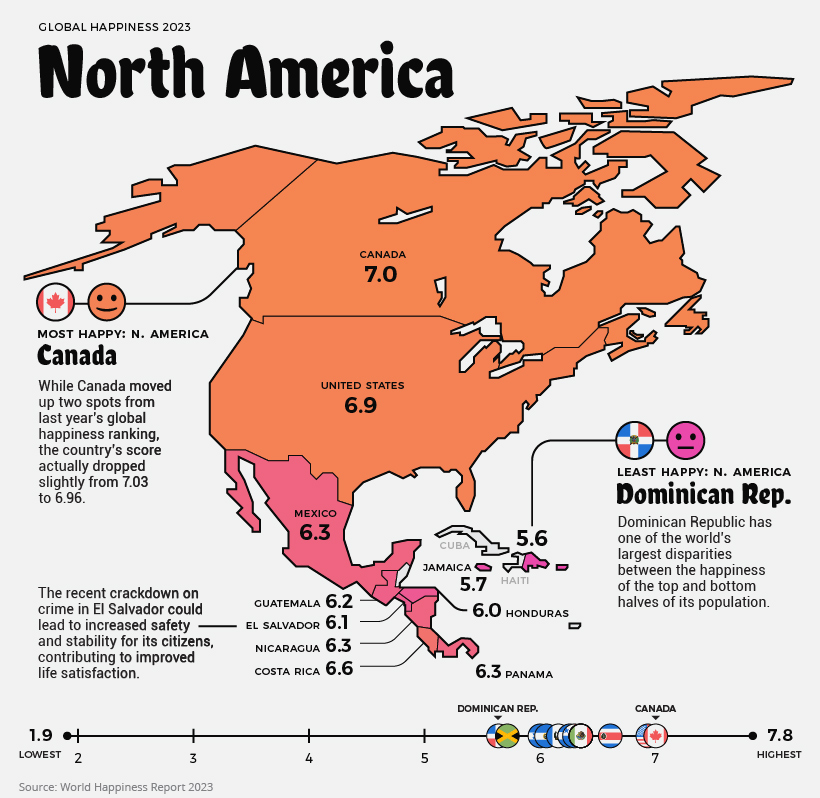
North America
Current Mood: Happy (6.3)
North America’s happiness score averages out to 6.3/10. The happiest country in the region is Canada, slightly beating out the United States. However, the scores of both countries have actually decreased from last year. It’s difficult to pinpoint why citizens feel less satisfied, but inflation, economic uncertainty, and many other factors could play a role. The only countries to see improvement in North America were Nicaragua and Jamaica. Although a more recent development, many Jamaicans could be experiencing even more happiness in the near future, with a recent announcement of plans to increase the minimum wage by 44%.
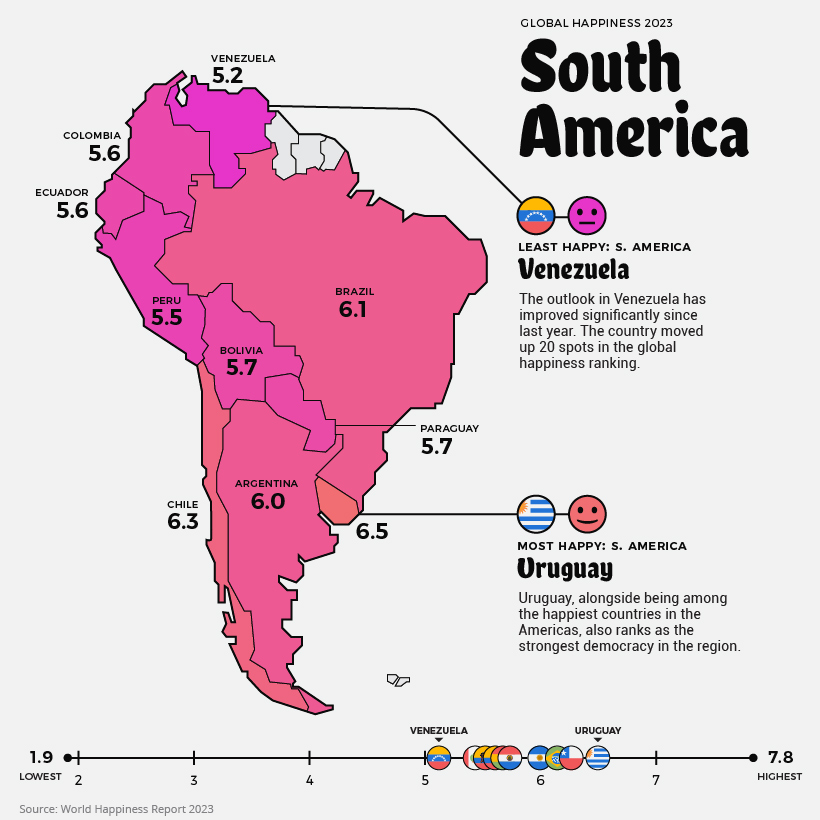
South America
Current Mood: Content (5.8)
South America’s average score is 5.8. Although Venezuela is the continent’s least happy country, its score actually improved from 4.9 to 5.2. That said, the ongoing humanitarian and economic crisis is not likely to instill much hope into the average Venezuelan. Over 6.8 million people have fled the struggling nation since 2014. The two countries in the region with decreased scores were Brazil and Colombia, where citizens have reported feeling worse compared to the year before.
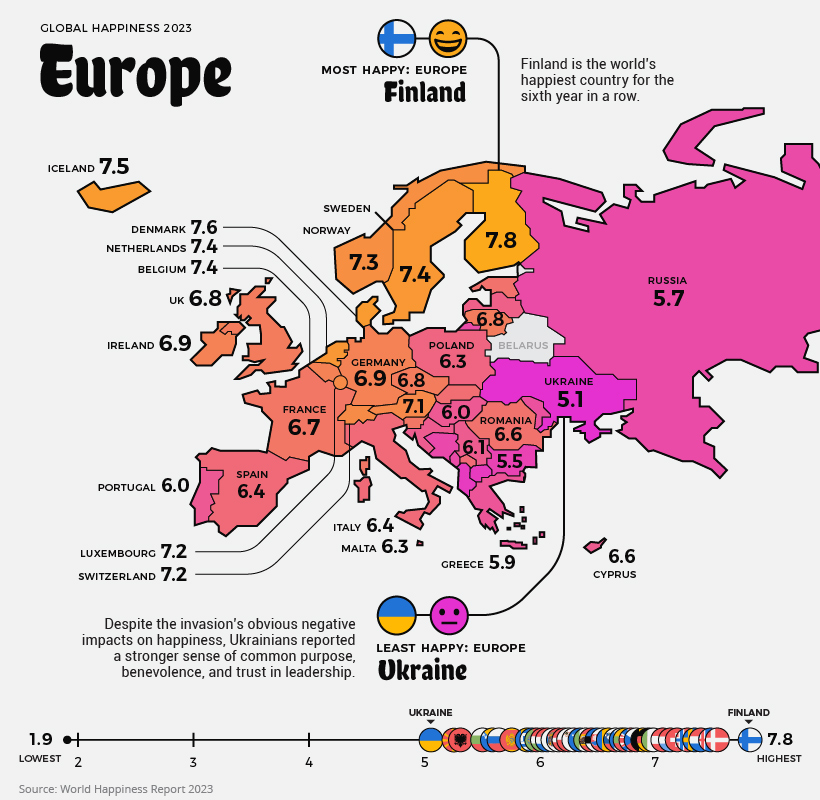
Europe
Current Mood: Happy (6.4)
Europe has some of the world’s happiest countries, with an average regional score of 6.4. Nordic countries like Finland, Sweden, and Iceland repeatedly report high scores, meaning people in these countries feel extremely satisfied with their lives.
Despite fending off an invasion, Ukrainians saw no diminishment of their happiness year-over-year, and many are feeling resilient and purposeful in their fight for freedom. Interestingly, Russia’s score actually increased slightly compared to last year, going from 5.5 to 5.7.
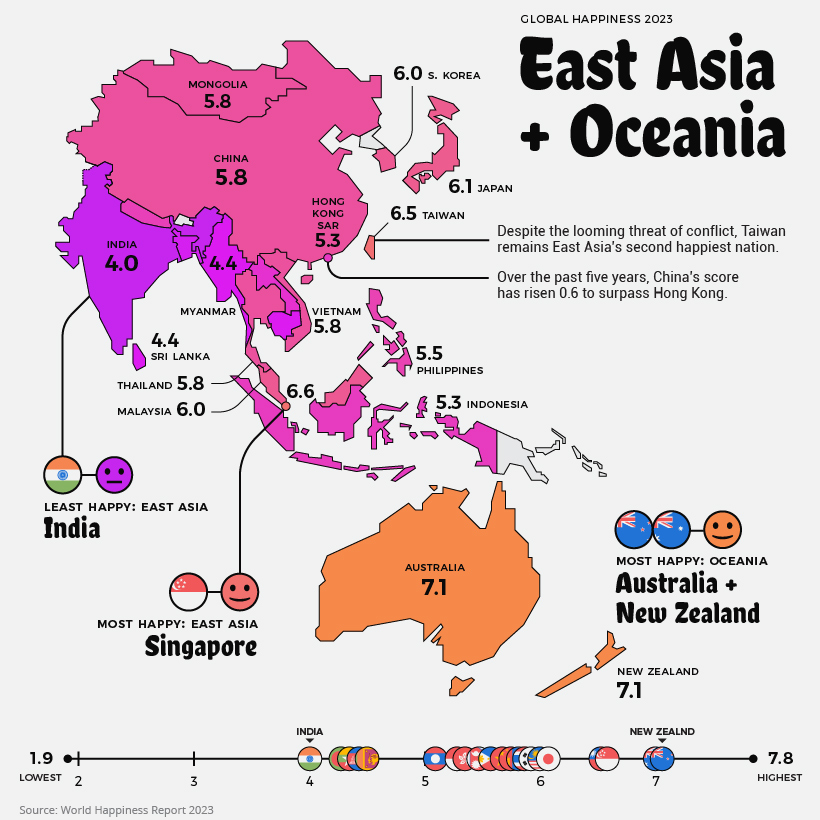
East Asia and Oceania
Current Mood: Neutral (5.6)
East Asia and Oceania’s collective average is 5.6. Oceania alone, however, would have the highest regional score in the world, at 7.1. Bucking conventional wisdom—at least in the West—China has seen a noteworthy bump (+0.6) in its score in recent years. Across the strait, Taiwan records the second highest score in East Asia, after Singapore. India once again has the lowest happiness score in its region. The country’s score has dropped -0.7 over the past decade.
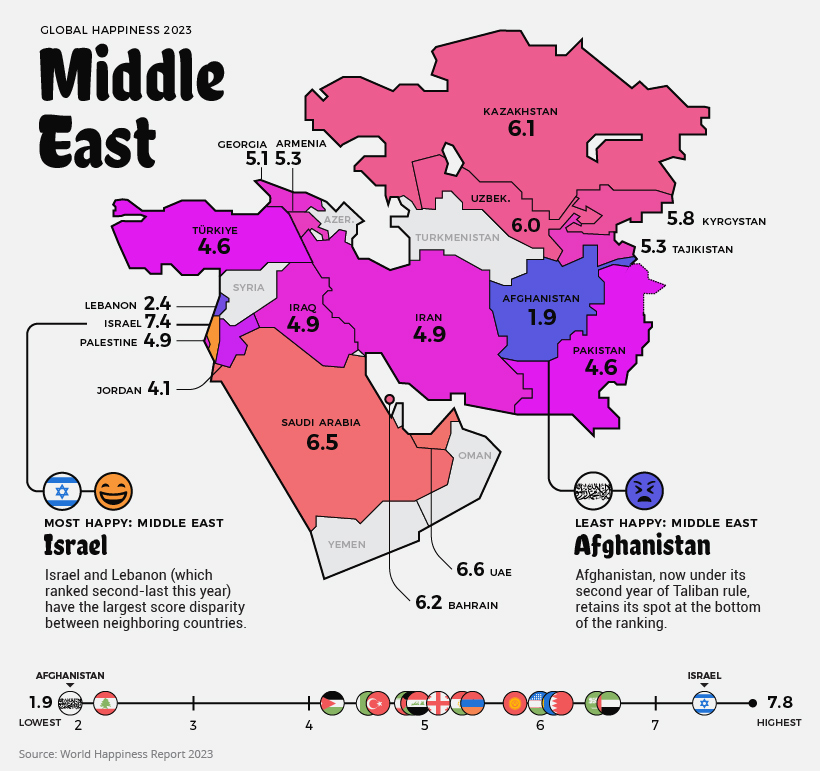
Central Asia and The Middle East
Current Mood: It’s Complicated (5.2)
The average score in the Middle East and Central Asia is 5.2, and the array of happiness scores is wider than in any other region. Afghanistan is the world’s least happy country, with citizens having reported extremely low levels of life satisfaction. Since the Taliban takeover, life has become objectively worse for Afghans, particularly women. There is a lot of conflict in the region. Citizens of Armenia face particular tension with neighboring Azerbaijan, whose score was not recorded for this year. Conflicts in the Nagorno-Karabakh region have led to hundreds of deaths since 2020 and cause daily struggle for those who live in the disputed territory. Iran is still under economic sanctions and faces ongoing tensions with the U.S. and Israel. Some countries, like Syria and Yemen, are so destabilized that no data is available. Still, there are bright spots as well. Israel has one of the world’s happiest countries with a top 10 score this year, and Saudi Arabia and the UAE have scores on par with many European countries.
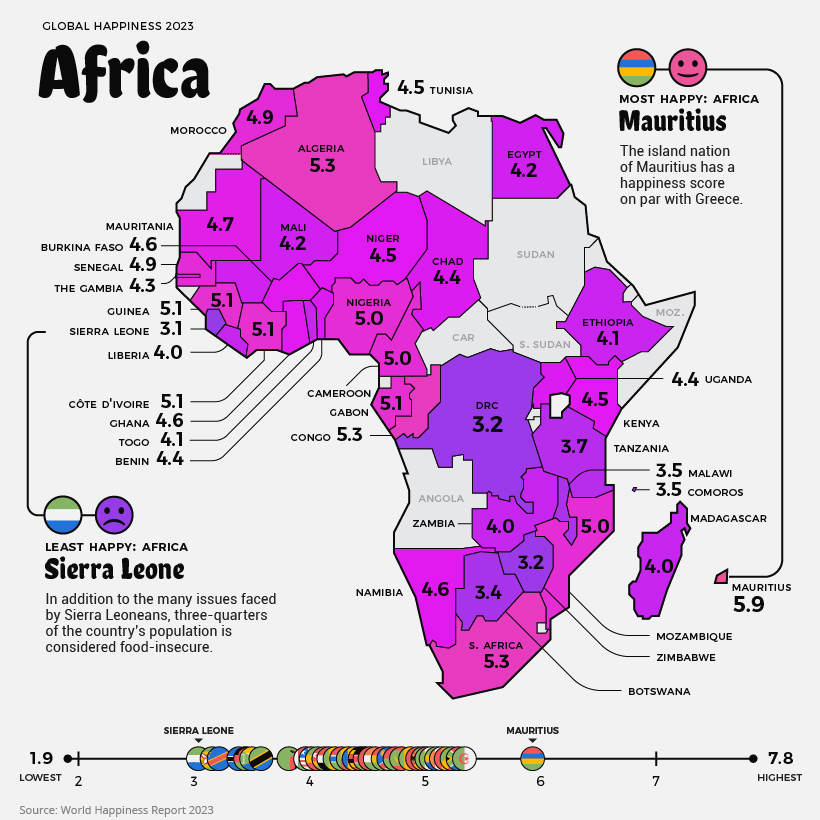
Africa
Current Mood: Unhappy (4.4)
The least happy region, Africa, averages out to a score of 4.4, and there is a lot of regional variation. The highest score in Africa goes to the island nation of Mauritius. In addition to the country’s natural beauty and stability, there is growing economic opportunity. Mauritius is classified as an upper-middle-income country by World Bank, and is one of the fastest growing high-income markets in the world. Sierra Leone has the lowest score of African countries that were included in the index, followed by Zimbabwe and the Democratic Republic of the Congo. It’s worth noting, there are a few data gaps in the region, including Burundi, which is currently the poorest country in the world. Source: The World Happiness Report which leverages data from the Gallup World Poll. Methodology: A nationally representative group of approximately 1,000 people is asked a series of questions relating to their life satisfaction, as well as positive and negative emotions they are experiencing. The life evaluation question is based on the Cantril ladder, wherein the top of the ladder represents the best possible life for a person (a score of 10/10) and on the flipside, the worst possible life (scored as 0/10). The main takeaway is that the scores result from self-reported answers by citizens of each of these countries. The results received a confidence interval of 95%, meaning that there is a 95% chance that the answers and population surveyed represent the average. As well, scores are averaged over the past three years in order to increase the sample size of respondents in each country. Criticisms: Critics of the World Happiness Report point out that survey questions measure satisfaction with socioeconomic conditions as opposed to individual emotional happiness. As well, there are myriad cultural differences around the world that influence how people think about happiness and life satisfaction. Finally, there can be big differences in life satisfaction between groups within a country, which are averaged out even in a nationally representative group. The report does acknowledge inequality as a factor by measuring the “gap” between the most and least happy halves of each country.