The dynamic nature of society makes it difficult to decipher. However, despite the world’s complexity, there are some long-term trends that have emerged among the chaos. These help us make sense of the world today, and can give us an idea of what to expect in years ahead. Here’s a look at five long-term trends that are set to transform society as we know it.
#1: Aging World
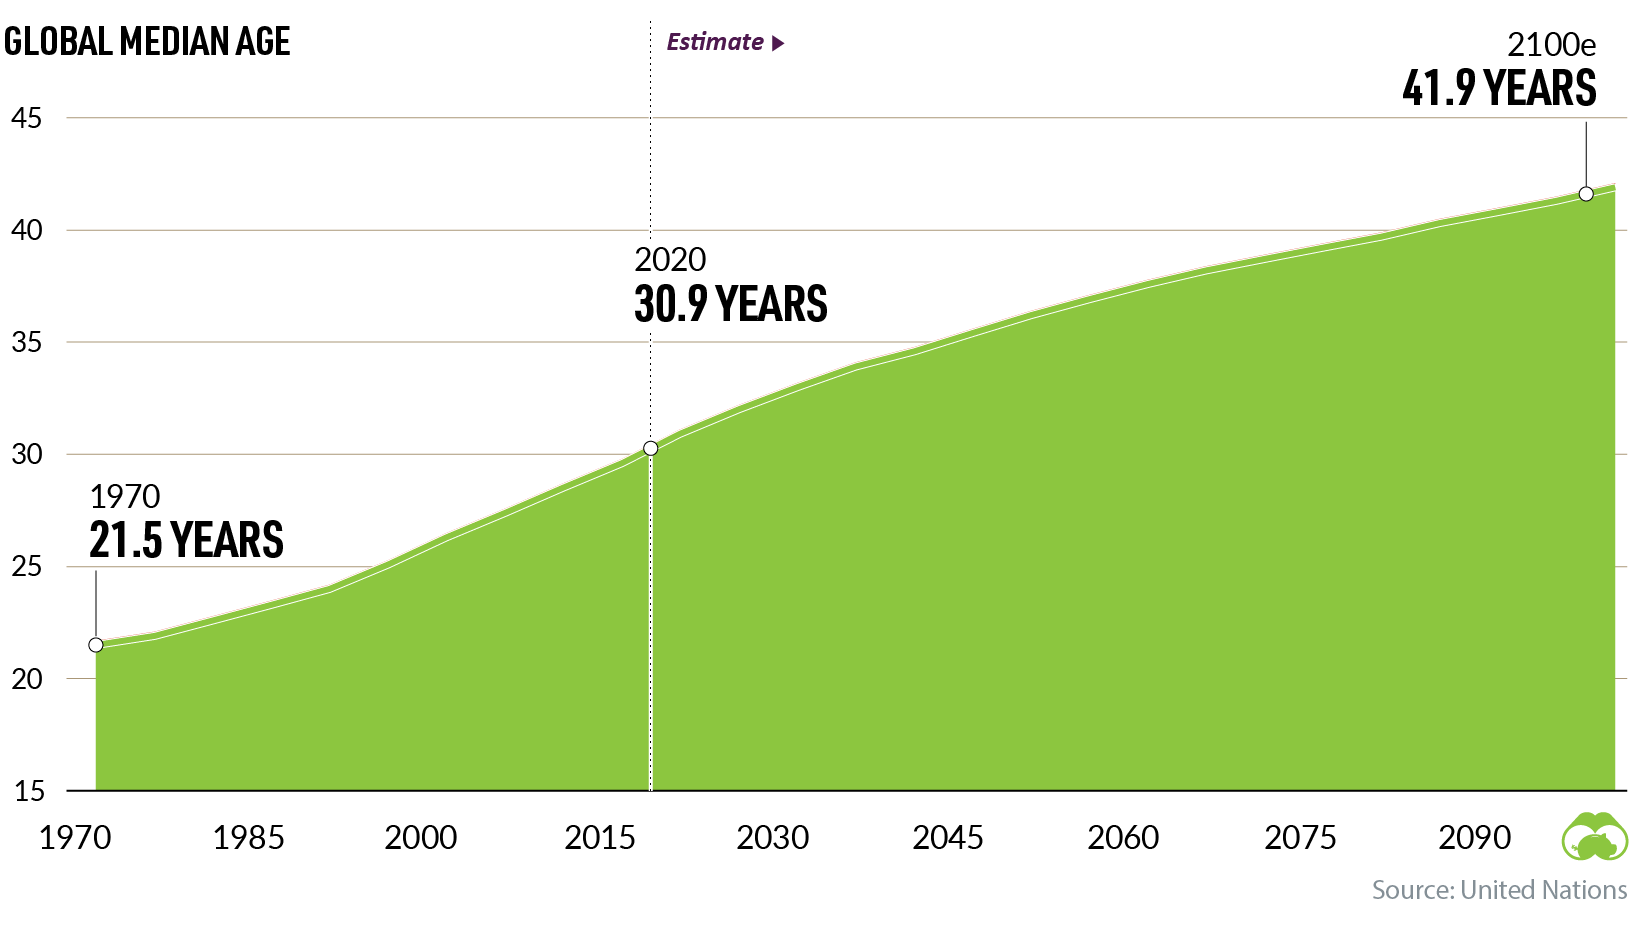
With every successive year, our global population is skewing older. Since 1970, our worldwide median age has grown by almost a decade. By 2100, it’s projected to increase by another 10 years.
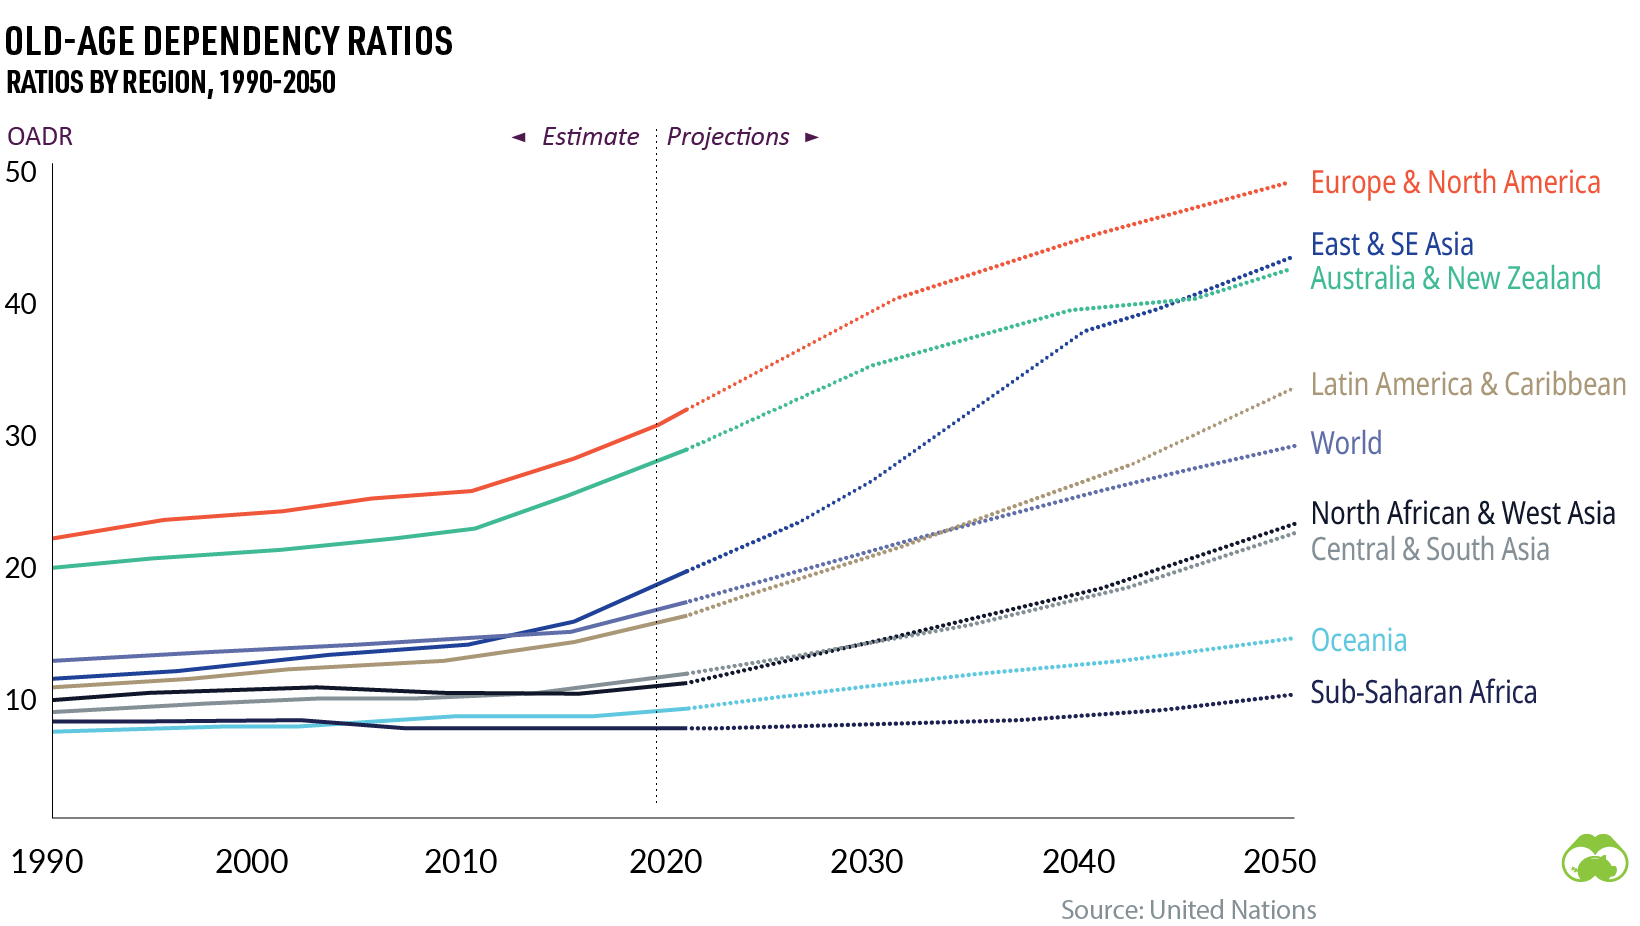
Of course, not all countries are aging at the same rate. Using data from the UN, the graph below covers the old-age dependency ratios (OADR) of different regions, showing the proportion of working-age citizens versus the percentage of older people, who are less likely to remain in the workforce.
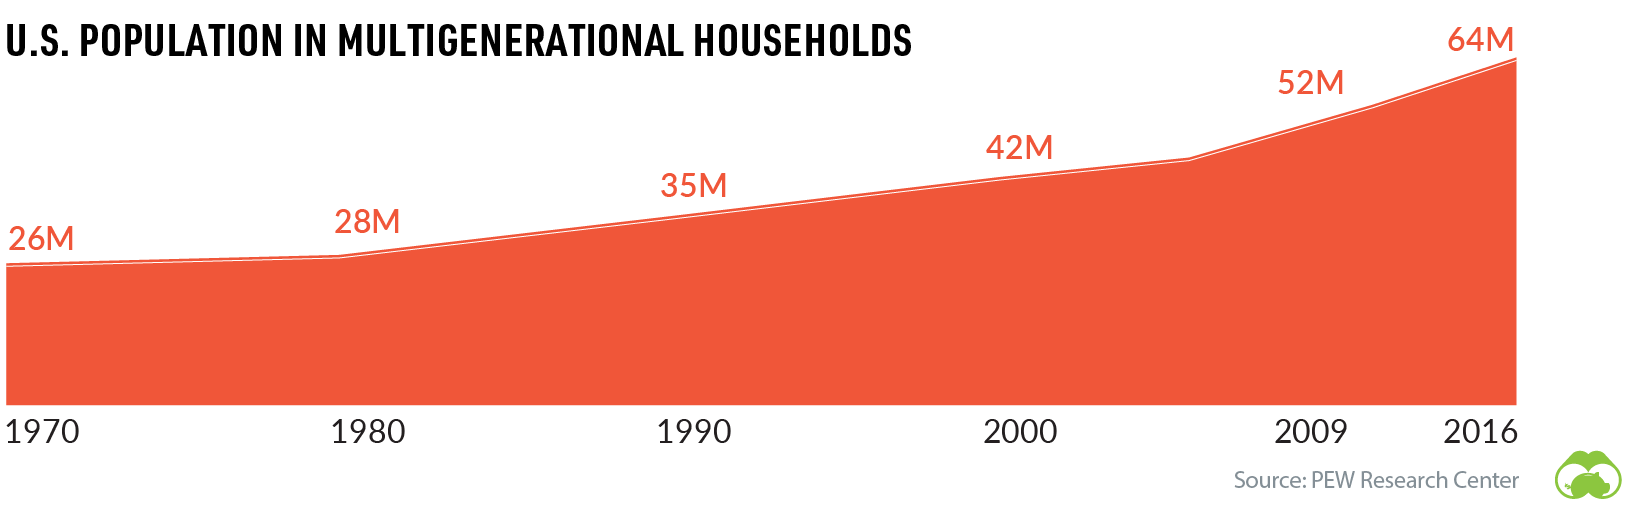
What’s the economic impact of an aging population? Some potential risks include rising healthcare costs, a shrinking workforce, and even economic slowdowns. To mitigate some of these risks, it’s crucial that countries build solid pension systems to support their aging citizens. Other potential solutions include increasing the age of retirement, enforcing mandatory retirement plans, and limiting early access to benefits. Aging populations are also influencing the make-up of households in many countries. In the U.S., the share of multigenerational family households has been rising steadily since the 1970s.
At a societal level, people in the oldest age groups often play a different role in society than working age people. Many seniors engage in volunteerism and play a pivotal role in childcare for their families–activities that fall outside traditional measures of economic activity.
#2: Urban Evolution
Another macro trend that’s set to transform many regions of the world is rapid urbanization. Currently, more than half of the global population lives in urban areas, and this influx of city-dwellers is expected to grow even more in the years ahead.
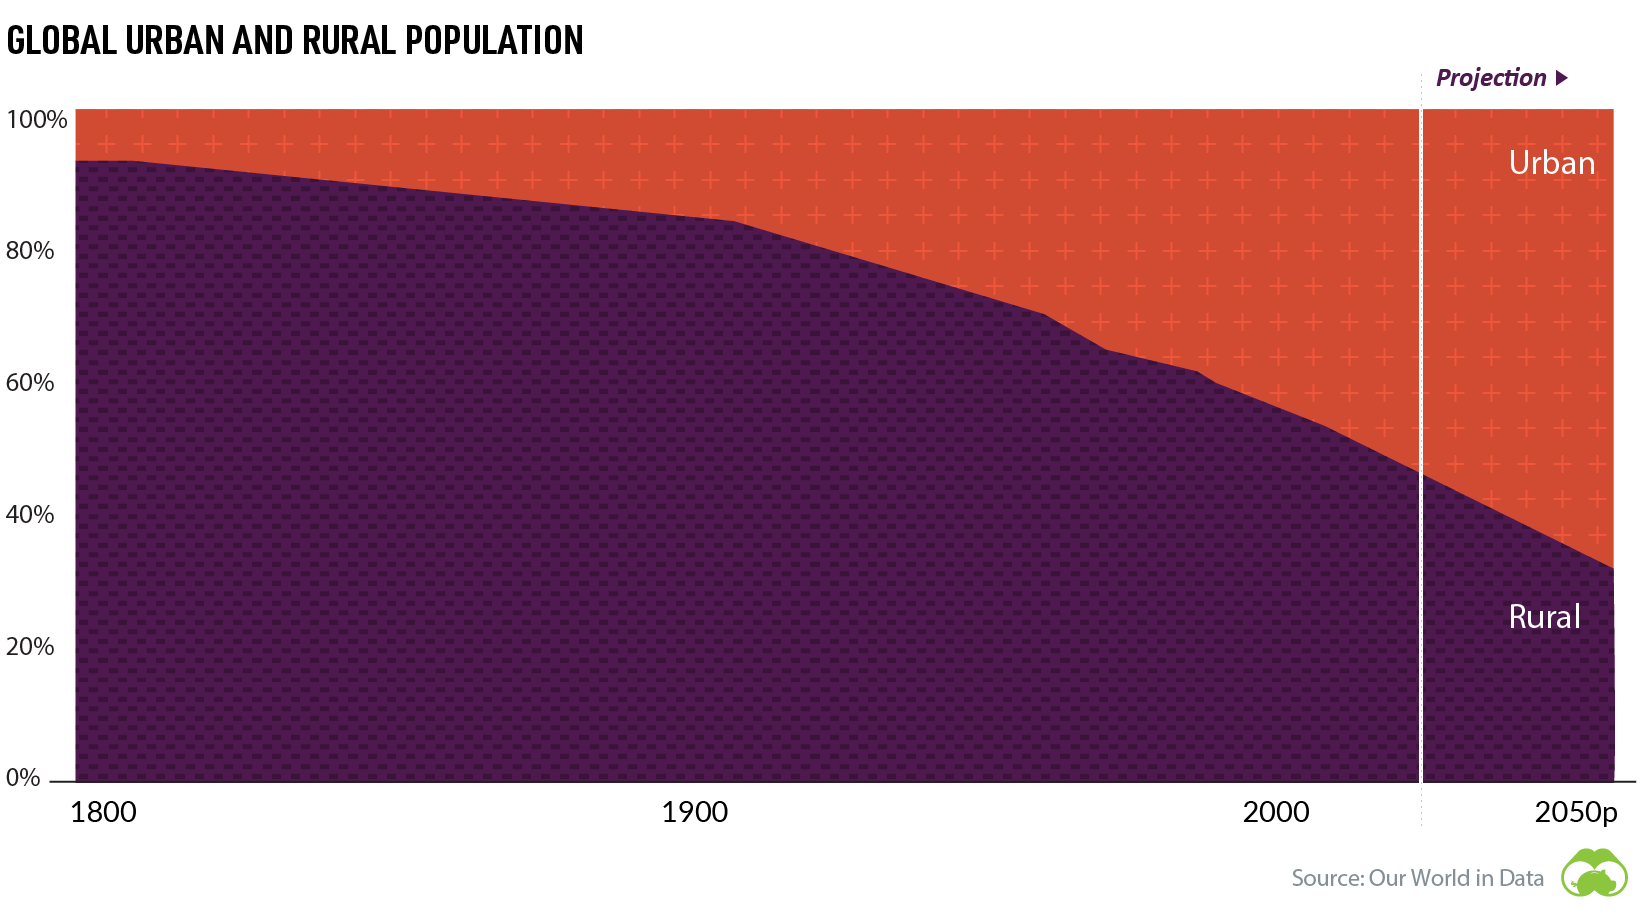
While urbanization may seem like an long-established phenomenon, it’s actually a relatively new trend, historically speaking. Throughout human history, populations have typically lived in small villages. All the way up to the early 1800s, close to 90% of the global population still lived in rural areas. Urbanization didn’t take off on a widespread scale until the 20th century. But once urban migration started, it snowballed, and since then it’s shown no signs of slowing down. By 2050, over two-thirds of the global population is expected to live in urban settings.
The Rise of Megacities
Even in developing countries, urban life is becoming the norm – a shift that is causing a boom in megacity growth. The median population size of the world’s top 100 cities has been growing steadily too – from eight million in 2000 to a projected 12 million in 2035. Why is this happening? People tend to migrate to urban areas for socioeconomic reasons, and these economic pull-factors are particular strong in the developing world. Over time, this migration and increase in the standard of living is lifting millions of people out of poverty. This brings us to our third trend. If you like this post, find hundreds of charts like this in our new book “Signals”:
#3: Rising Middle Class
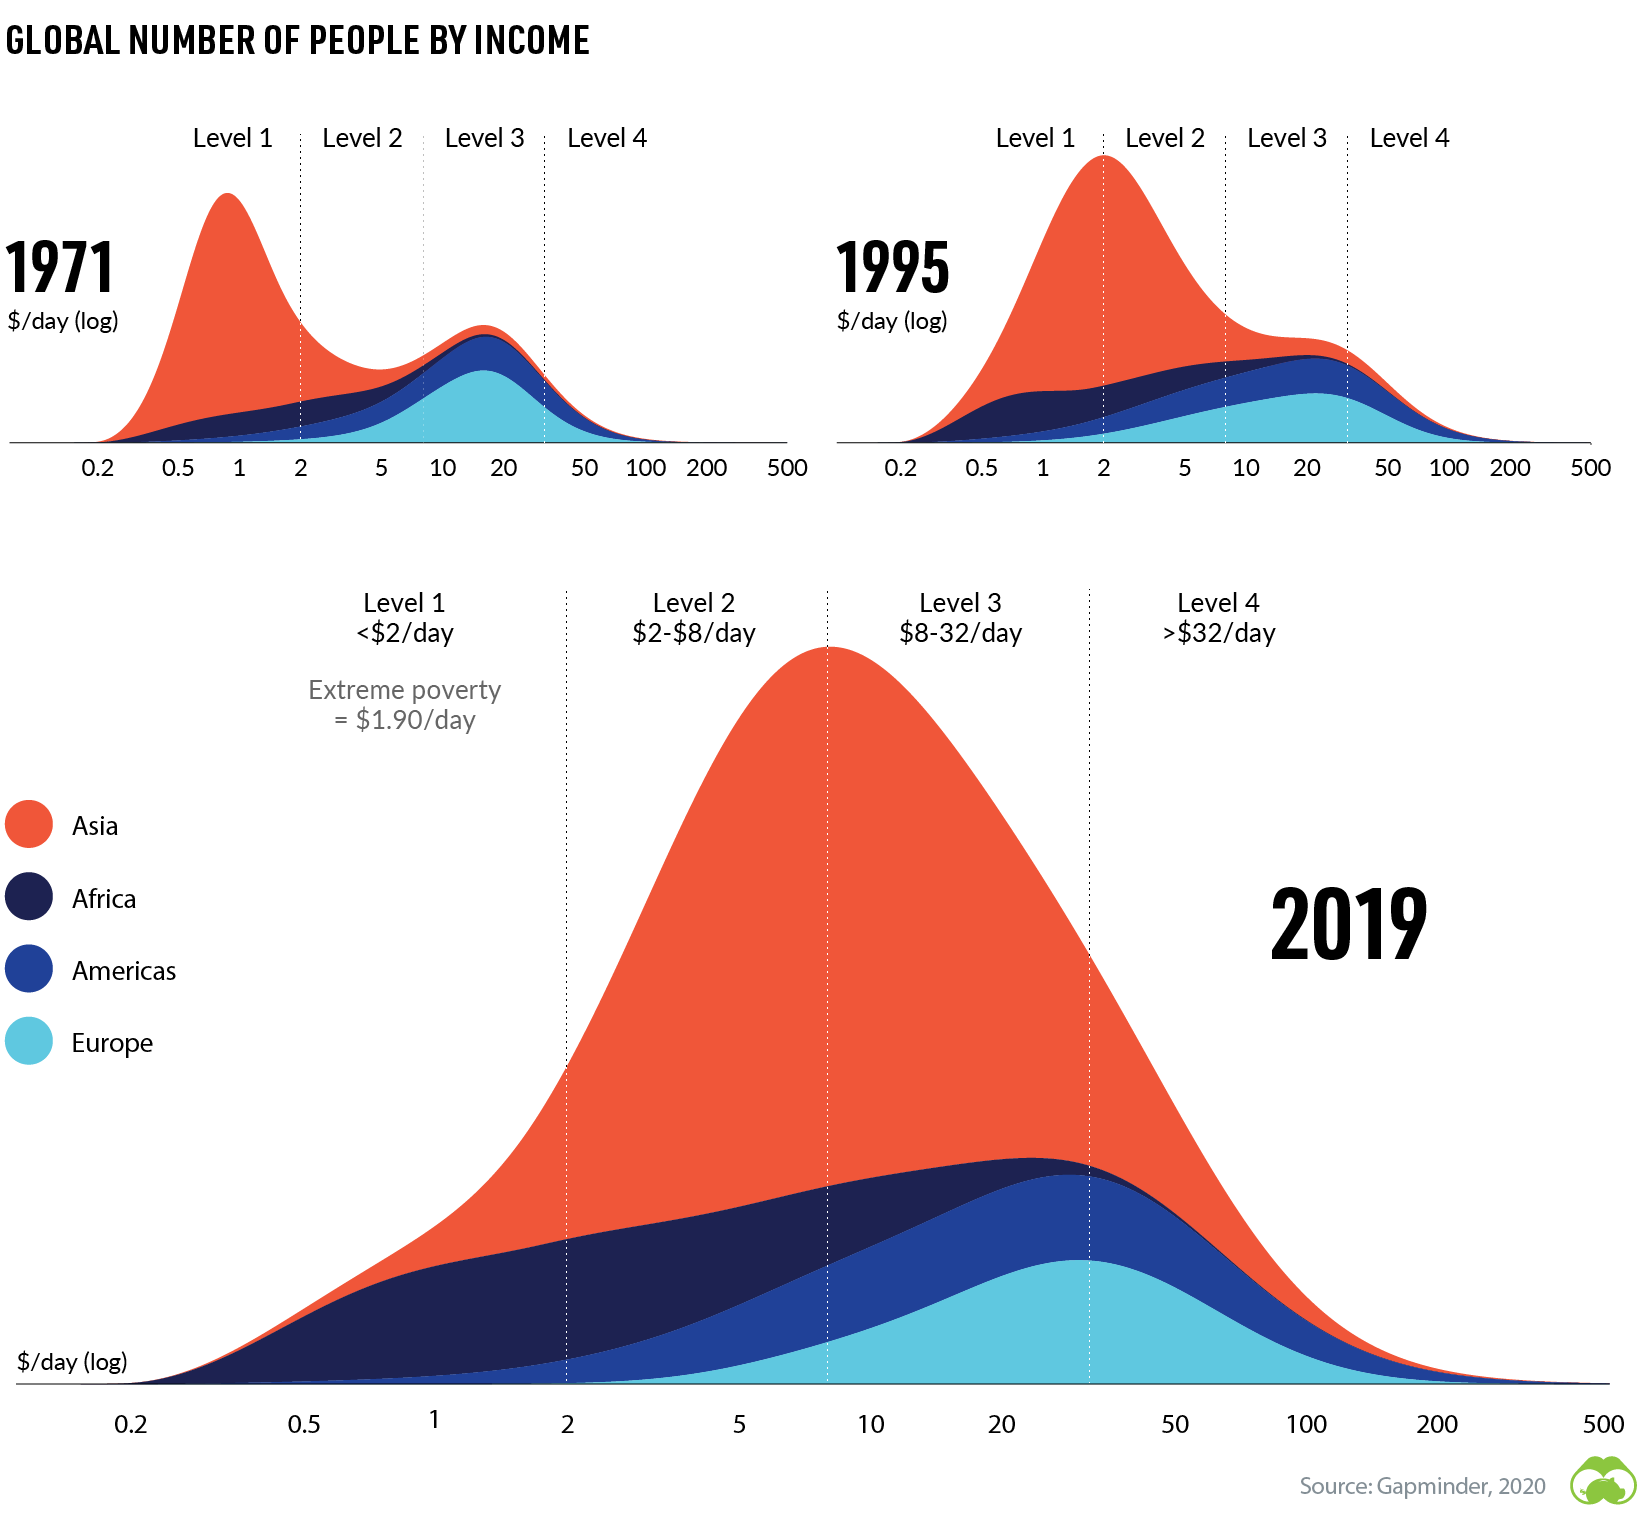
While poverty is far from eradicated, the global middle class is growing, and fewer people are living in extreme poverty than ever before.
As the above graph shows, there was an overall increase in daily income from 1971 to 1995. By 2019, income levels had increased even further. According to Brookings, an average of five people are entering the global middle class per second, and by 2030, the worldwide middle class population is expected to reach 5.3 billion. As the global middle class grows, so does the market for products and services around the world. And as the middle class has more disposable income to spend, these developing markets can create new opportunities for companies and investors alike. In fact, according to MSCI, although global equity markets are dominated by North American companies (61.5%) in terms of market capitalization, the vast majority of revenues (70.1%) come from outside North America. As the rest of the developing world gets richer, this trend is likely to accelerate.
#4: Rising Wealth inequality
People in lower-income economies aren’t the only people generating more wealth—the richer are also increasing their net worth. By a lot.
Over the last few decades, the wealth of America’s top 10% has increased by billions of dollars, while the middle and bottom wealth groups have stayed relatively stagnant.
What’s driving this wealth inequality? One key factor is the different types of assets each wealth group owns. While the top 10% invest heavily in the stock market, other wealth groups rely on real estate as their main form of investment.
Historically, equities have had higher returns than real estate—making the rich richer and leaving the bottom 90% behind.
#5: Environmental Pressures
So far, we’ve touched on four demographic shifts that are transforming society as we know it. But these changes in our global population size, wealth, and consumption habits have had far-reaching consequences. This last trend touches on one of those consequences—increased environmental pressure.
Since the year 1850, the global average temperature of land areas has risen twice as fast as the global average.
Various factors have contributed to increasing temperatures, but one major source stems from human-produced greenhouse gas emissions.
What human activities contribute to global emissions the most? The biggest culprit is industrial activity—32% of total emissions, while energy use in buildings comes in second at 17%.
Our Warmer World
Why is this significant? Rising temperatures pose a risk to our ecosystems and livelihood by changing weather patterns and putting the global food supply at risk. The past half-decade is likely to become the warmest five-year stretch in recorded history, underscoring the rapid pace of climate change. On a global scale, even a small increase in temperature can have a big impact on climate and our ecosystems. For example, air can hold approximately 7% more moisture for every 1ºC increase, leading to an uptick in extreme rainfall events. These events can trigger landslides, increase the rate of soil erosion, and damage crops – just one example of how climate change can cause a chain reaction. For the billions of people who live in “drylands”, climate change is serving up a completely different scenario of increased intensity and duration of drought. This is particularly worrisome as 90% of people in these arid or semiarid regions live in developing economies that are still very reliant on agriculture. As a society, we will need to take a hard look at the way we consume in order to begin mitigating these risks. Will we rise to the challenge? If you like this post, find hundreds of charts like this in our new book “Signals”:
on To see how the minimum wage differs around the world, we’ve visualized data from Picodi, which includes values for 67 countries as of January 2023.
Monthly Minimum Wage, by Country
The following table includes all of the data used in this infographic. Each value represents the monthly minimum wage a full-time worker would receive in each country. Picodi states that these figures are net of taxes and have been converted to USD. Generally speaking, developed countries have a higher cost of living, and thus require a higher minimum wage. Two outliers in this dataset are Argentina and Turkey, which have increased their minimum wages by 100% or more from January 2022 levels. Turkey is suffering from an ongoing currency crisis, with the lira losing over 40% of its value in 2021. Prices of basic goods have increased considerably as the Turkish lira continues to plummet. In fact, a 2022 survey found that 70% of people in Turkey were struggling to pay for food. Argentina, South America’s second-biggest economy, is also suffering from very high inflation. In response, the country announced three minimum wage increases throughout 2022.
Minimum Wage in the U.S.
Within the U.S., minimum wage varies significantly by state. We’ve visualized each state’s basic minimum rate (hourly) using January 2023 data from the U.S. Department of Labor.
2023-03-17 Update: This map was updated to fix several incorrect values. We apologize for any confusion this may have caused. America’s federal minimum wage has remained unchanged since 2009 at $7.25 per hour. Each state is allowed to set their own minimum wage, as long as it’s higher than the federal minimum. In states that do not set their own minimum, the federal minimum applies. If we assume someone works 40 hours a week, the federal minimum wage of $7.25 translates to an annual figure of just $15,080 before taxes. California’s minimum wage of $15.50 translates to $32,240 before taxes. For further perspective, check out our 2022 infographic on the salary needed to buy a home across 50 U.S. cities.