What Recovery? [Chart]
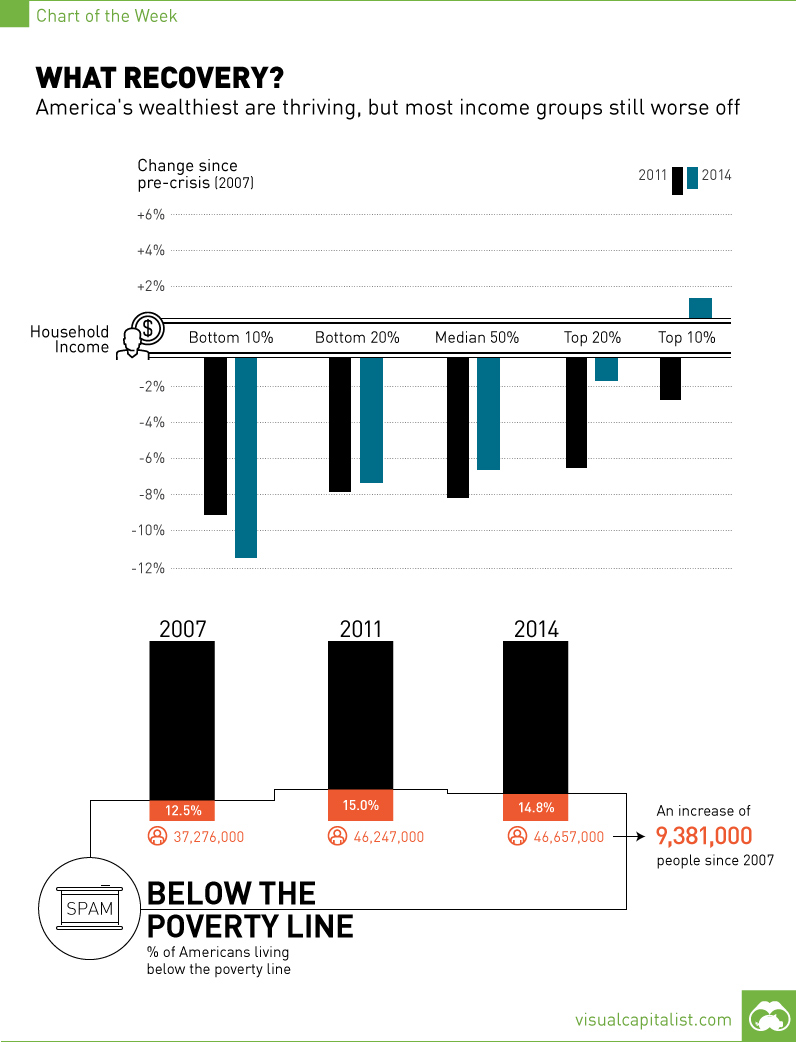
9.4 Million More Americans Below Poverty Line Than Pre-Crisis
The Chart of the Week is a weekly Visual Capitalist feature on Fridays. According to Janet Yellen, we are still on pace to raise rates in 2015. While the rate hike was supposed to happen this month, it got derailed by the August market selloff, volatility in China, lackluster work force numbers, and a variety of other factors. Despite the Fed continuing to kick this down the road, they continue to claim that we are in the middle of an ongoing recovery. There’s just one problem with that: things are getting worse than pre-crisis levels for millions of the poorest Americans. It’s true that the wealthiest 10% of Americans have finally seen their household incomes rise above the levels last seen in 2007. It’s also true that median incomes have “recovered” from the worst of the 2008 disaster. Median earners were -8.1% worse off in 2011, and now they are only -6.5% worse off according to most recent data for 2014 released by the U.S. Census Bureau last week. However, when we look at the lowest 10% of income earners, the situation is much more precarious. In 2011, the bottom 10% of households were -9.0% worse off in terms of income than they were pre-crisis. Since then, it hasn’t gotten any better: they now are making -11.6% less income than they were in 2007. Possibly even more concerning is the fact that the amount of Americans living below the poverty line has soared since 2007. There are now 9.4 million more people that can claim to be a part of this unfortunate group, and the total contingent living below the poverty line now makes up 14.8% of all Americans. This is also an increase from the 12.5% figure from before the Great Recession. What’s the difference between 2007 and today? One stark contrast is the fact that the Fed’s balance sheet has exploded by adding $3.5 trillion of phony money to its balance sheet (that’s about the size of Germany’s economy) with its Quantitative Easing (QE) program. As part of the same experiment, it kept rates artificially low at near 0% for a record amount of time to encourage both lending and economic growth. However, it is seven years later, and we are starting to see the fruits of this experiment especially in terms of wealth inequality. Studies and economists are starting to sound off, noting that QE and ZIRP have been a failure for America’s poorest. We explained the basics in a previous chart, but here’s some other articles worth reading from Forbes, WSJ, and SCMP that help show the effect of these policies. By the way, the St. Louis Fed has essentially admitted QE was a mistake, while the Philadelphia Fed also admitted that these policies likely helped cause income inequality. Even fragilista economist Joseph Stiglitz has said this summer that ZIRP has helped increase income inequality.
on A lagging stock market dented these fortunes against high interest rates, energy shocks, and economic uncertainty. But some of the world’s billionaires have flourished in this environment, posting sky-high revenues in spite of inflationary pressures. With data from Forbes Real-Time Billionaires List, we feature a snapshot of the richest people in the world in 2023.
Luxury Mogul Takes Top Spot
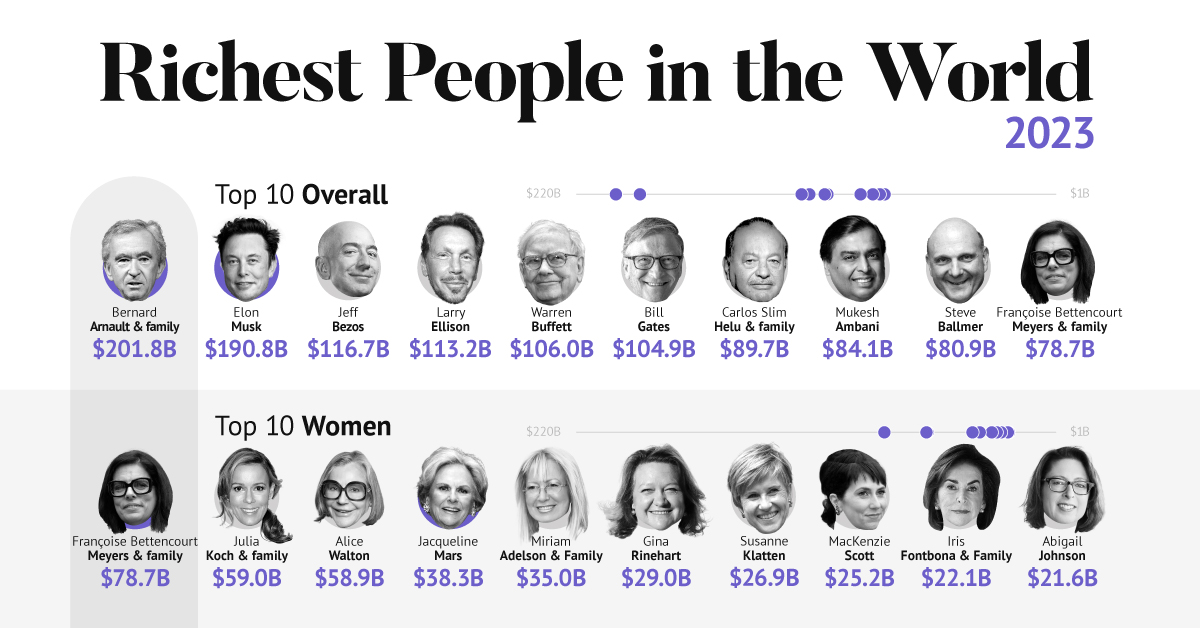
The world’s richest person is France’s Bernard Arnault, the chief executive of LVMH.
With 75 brands, the luxury conglomerate owns Louis Vuitton, Christian Dior, and Tiffany. LVMH traces back to 1985, when Arnault cut his first major deal with the company by acquiring Christian Dior, a firm that was struggling with bankruptcy.
Fast-forward to today, and the company is seeing record profits despite challenging market conditions. Louis Vuitton, for instance, has doubled its sales in four years.
In the table below, we show the world’s 10 richest people with data as of February 27, 2023:
Elon Musk, the second-wealthiest person in the world has a net worth of $191 billion. In October, Musk took over Twitter in a $44 billion dollar deal, which has drawn criticism from investors. Many say it’s a distraction from Musk’s work with Tesla.
While Tesla shares have rebounded—after falling roughly 70% in 2022—Musk’s wealth still sits about 13% lower than in March of last year.
Third on the list is Jeff Bezos, followed by Larry Ellison. The latter of the two, who founded Oracle, owns 98% of the Hawaiian island of Lanai which he bought in 2012 for $300 million.
Fifth on the list is Warren Buffett. In his annual letter to shareholders, he discussed how Berkshire Hathaway reported record operating profits despite economic headwinds. The company outperformed the S&P 500 Index by about 22% in 2022.
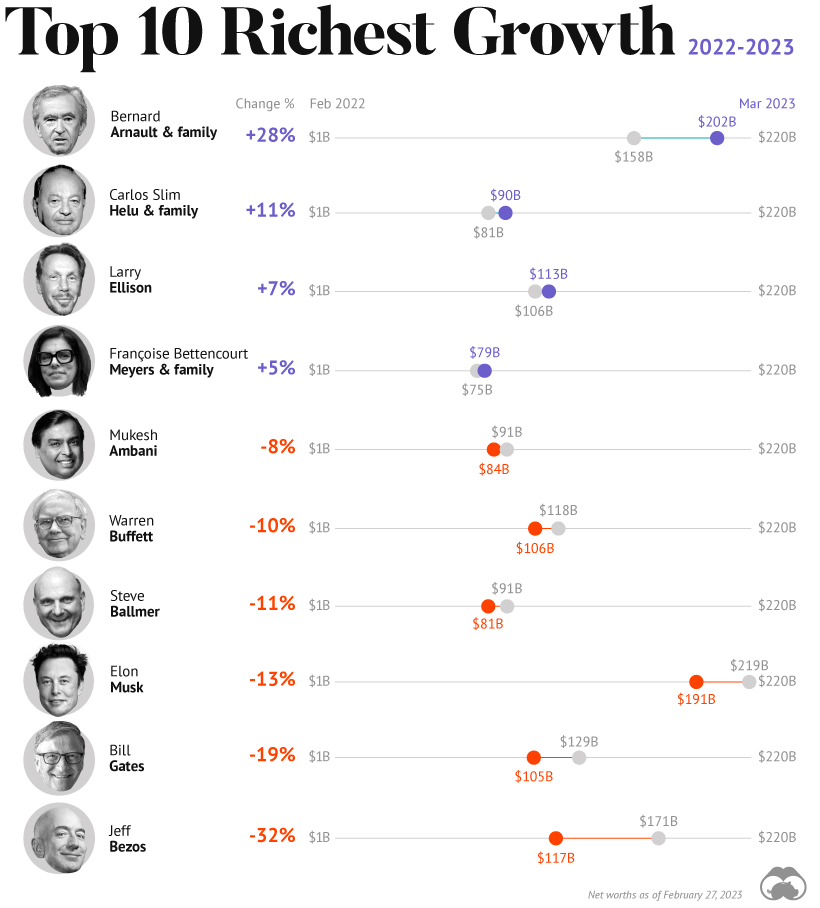
How Fortunes Have Changed
Given multiple economic crosscurrents, billionaire wealth has diverged over the last year. Since March 2022, just four of the top 10 richest in the world have seen their wealth increase. Two of these are European magnates, while Carlos Slim Helu runs the largest telecom firm in Latin America. In fact, a decade ago Slim was the richest person on the planet. Overall, as the tech sector saw dismal returns over the year, the top 10 tech billionaires lost almost $500 billion in combined wealth.
Recent Shakeups in Asia
Perhaps the most striking news for the world’s richest centers around Gautam Adani, formerly the richest person in Asia. In January, Hindenburg Research, a short-selling firm, released a report claiming that the Adani Group engaged in stock manipulation and fraud. Specifically, the alleged the firm used offshore accounts to launder money, artificially boost share prices, and hide losses. The Adani Group, which owns India’s largest ports—along with ports in Australia, Sri Lanka, and Israel—lost $100 billion in value in the span of a few weeks. Interestingly, very few Indian mutual funds hold significant shares in Adani Group, signaling a lack of confidence across India’s market, which was also cited in Hindenburg’s report. As a result, Mukesh Ambani has climbed to Asia’s top spot, controlling a $84 billion empire that spans from oil and gas and renewable energy to telecom. His conglomerate, Reliance Industries is the largest company by market cap in India.