Beyond the headlines and raw census numbers, it can be difficult to take population patterns into perspective. The talented team over at The Pudding has created an amazing, granular map that shows these patterns as 3D stacks. Our focus today will be on growth between 1990 and 2015, as urban settlement patterns across Canada and the U.S. shifted dramatically over this relatively short timeframe. Let’s take a look.
Growing Cities
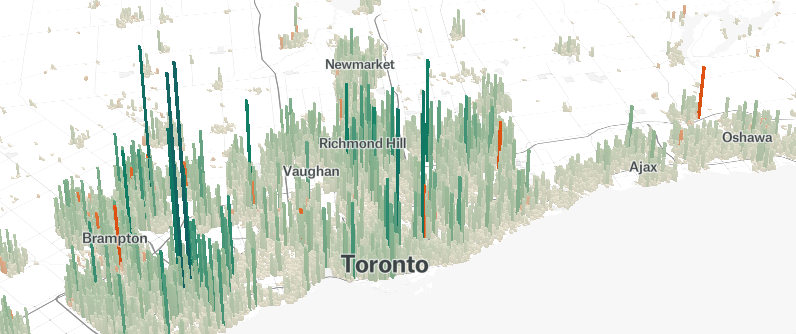
One of the most dramatic examples of robust growth is Toronto. Canada’s largest city nearly doubled its population since 1990, and growth was distributed throughout the region. This city is a rare example of both extra-urban and downtown residential growth.
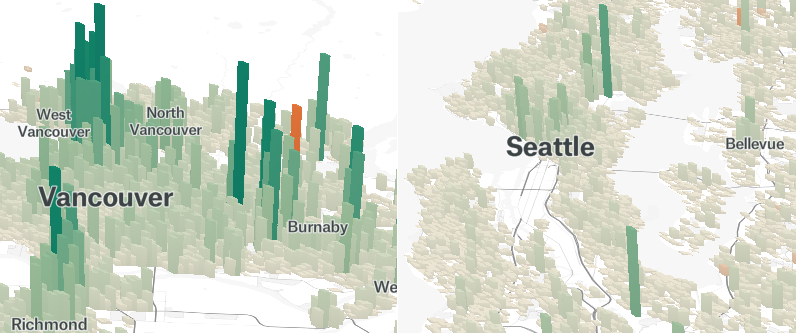
Vancouver is another Canadian city with a swelling urban population base. The city’s recent population growth has been heavily concentrated along transit lines and the downtown core, resulting in a “spiky” visualization which resembles the condo towers now dotting the city’s skyline. Nearby, Seattle has added over a million people to its population since 1990. With one of the strongest economies in the country, it’s unlikely that momentum will slow any time soon.
Growing Suburbs
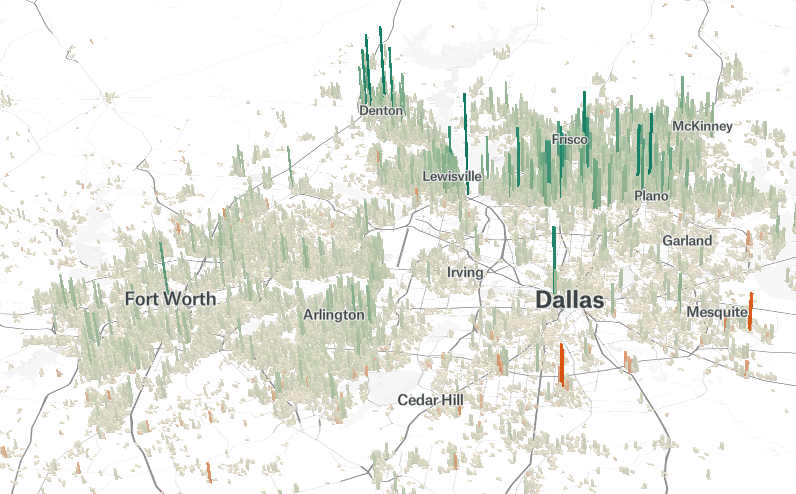
Only recently have some cities begun to see urban residential construction. For much of the ’90s and ’00s, America’s growth was in peripheral suburbs, where land was plentiful and cheap.
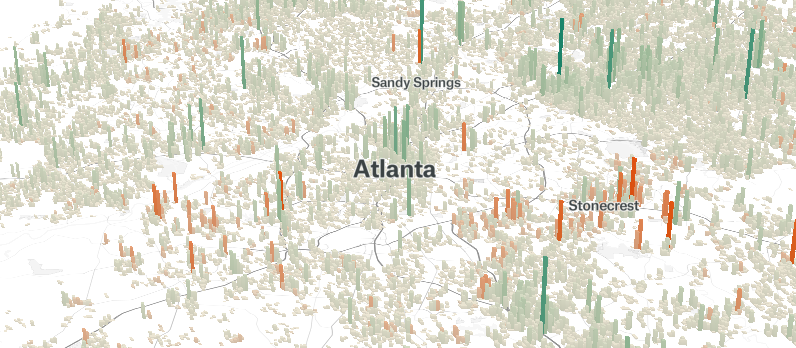
This sprawl effect is particularly easy to spot in the Texas Triangle – which encompasses the cities of San Antonio, Austin, Dallas–Fort Worth, and Houston – and Atlanta.
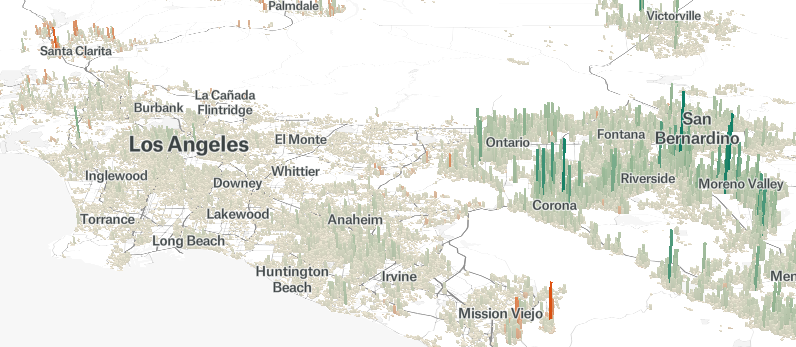
While Los Angeles did see a modest amount of growth over the past 25 years, it was the Inland Empire – anchored by San Bernardino and Riverside – that saw the most dramatic population growth in the region. The construction boom is only intensifying. The region added 50,000 new residents between 2016 and 2017.
Boomtowns
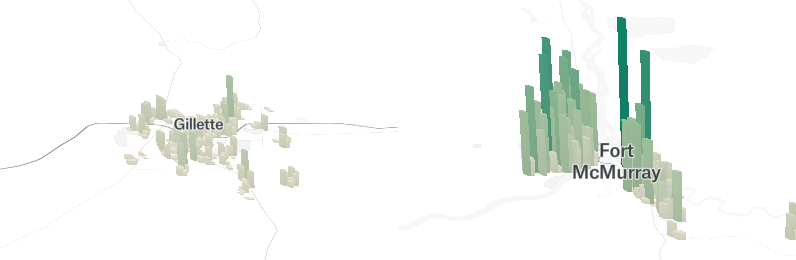
In general, smaller towns either lost population or remained relatively static. The exception is in places where resource extraction caused a growth spurt. Two prime examples are in Gillette, Wyoming, and Fort McMurray, Alberta. In the latter town, oil sands extraction added tens of thousands of new residents in a short amount of time.
Mixed growth and Static Cities
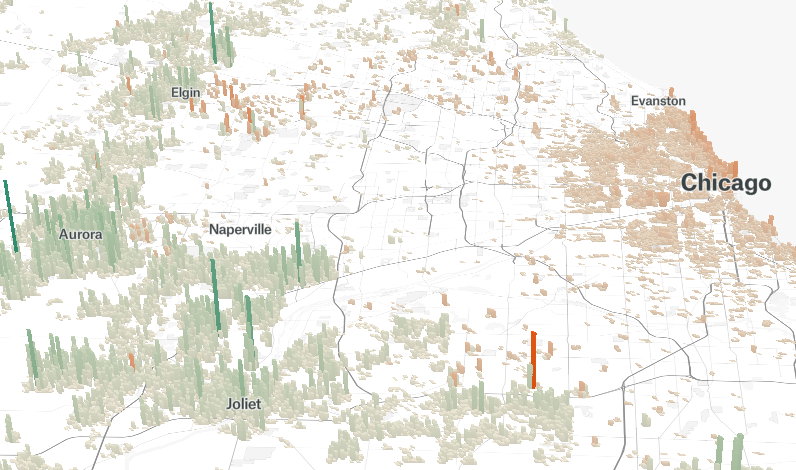
Chicago experienced one of the most striking growth patterns over the past 25 years. The contrast between urban decline and growth in the exurbs is clearly revealed in this visualization.
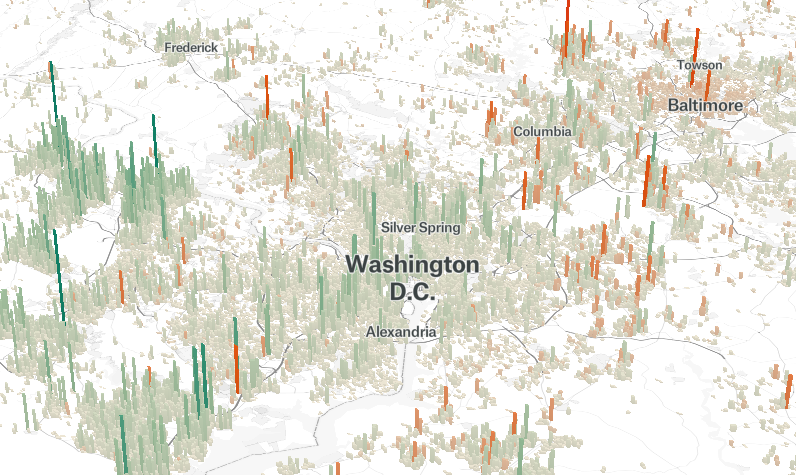
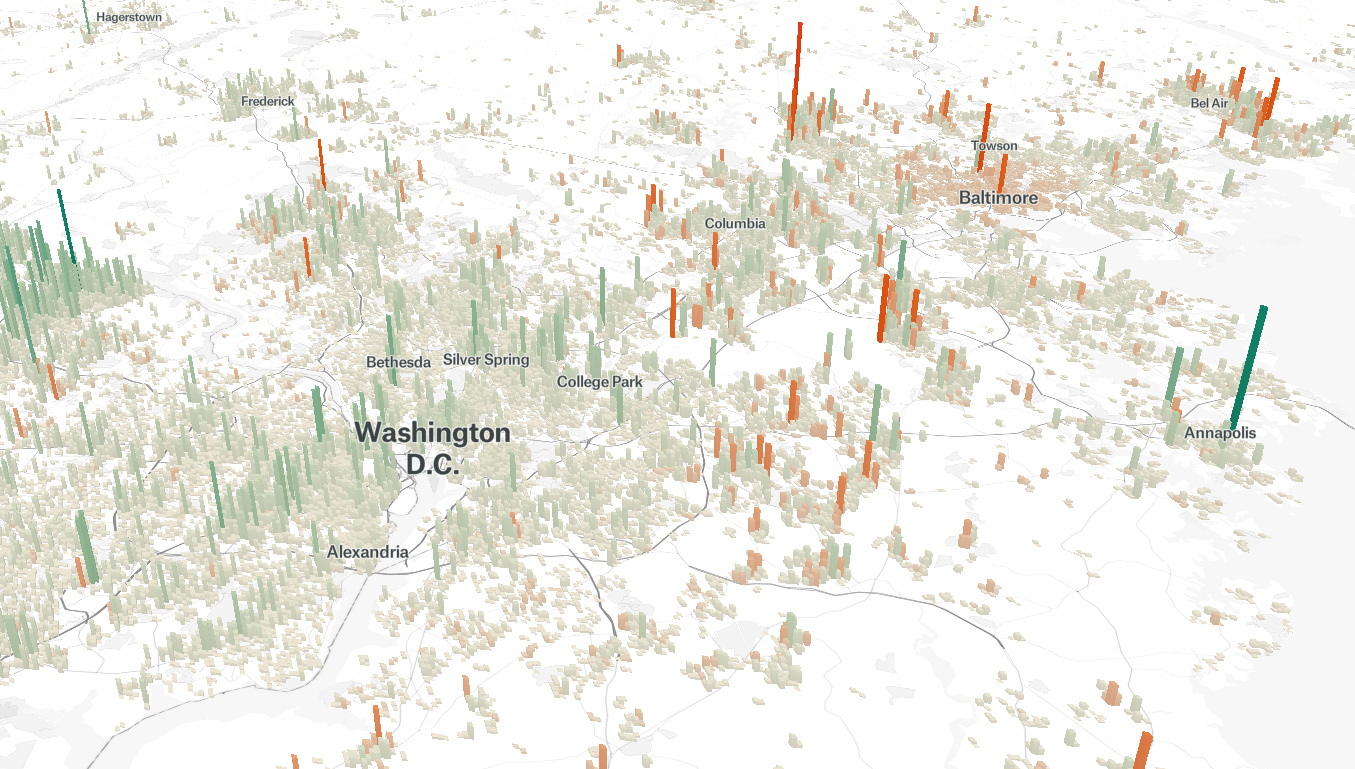
Contrast is also clear when looking at divergent patterns of Washington D.C. and Baltimore. The nation’s capital and surrounding areas have been growing steadily in recent years, whereas the neighboring city’s population is declining towards a 100-year low.
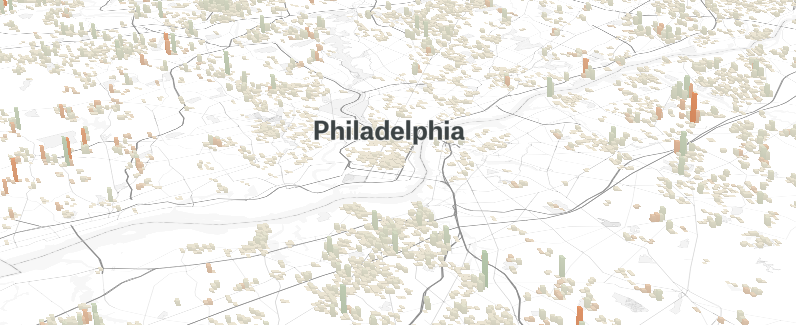
Static Cities
While a number of urban areas experienced dramatic shifts in the last couple of decades, some cities sidestepped wild population swings. For example, much of Philadelphia’s population pattern remains similar to what it was in 1990.
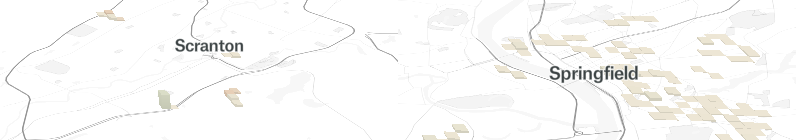
Scranton, Pennsylvania, and Springfield, Massachusetts, are examples of smaller cities that remained in stasis.
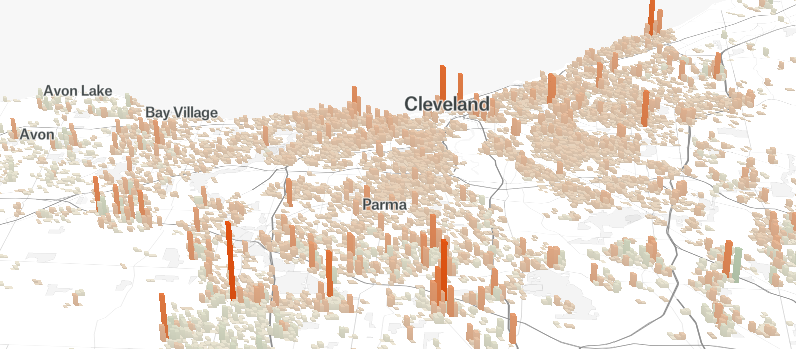
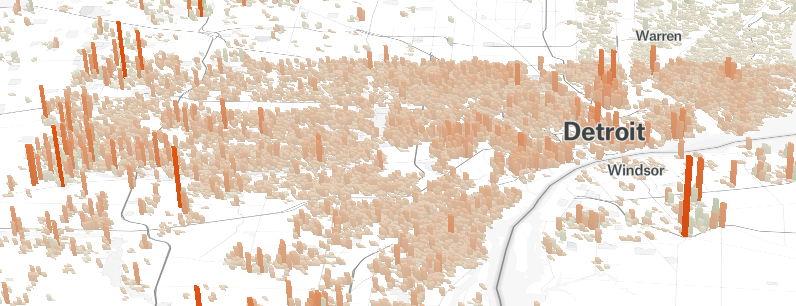
Decline and Disaster
A number of cities in America’s “Rust Belt” experienced declining populations. The visualizations of cities like Cleveland and Detroit show just how pronounced the exodus was.
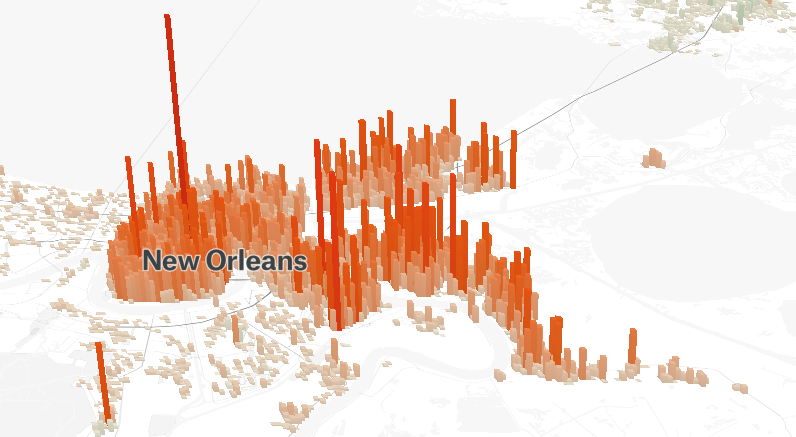
The shrinking tax base and glut of vacant homes is causing a number of problems in the two cities, and with mixed economic prospects, it’s unclear what the next 25 years will bring in terms of population changes. Often, population declines are the result of economic reasons such as a decline in manufacturing or general stagnation. On occasion though, the raw power of nature changes the course of a city’s history. This is the case in New Orleans, were Hurricane Katrina’s legacy is clearly seen in this visualization.
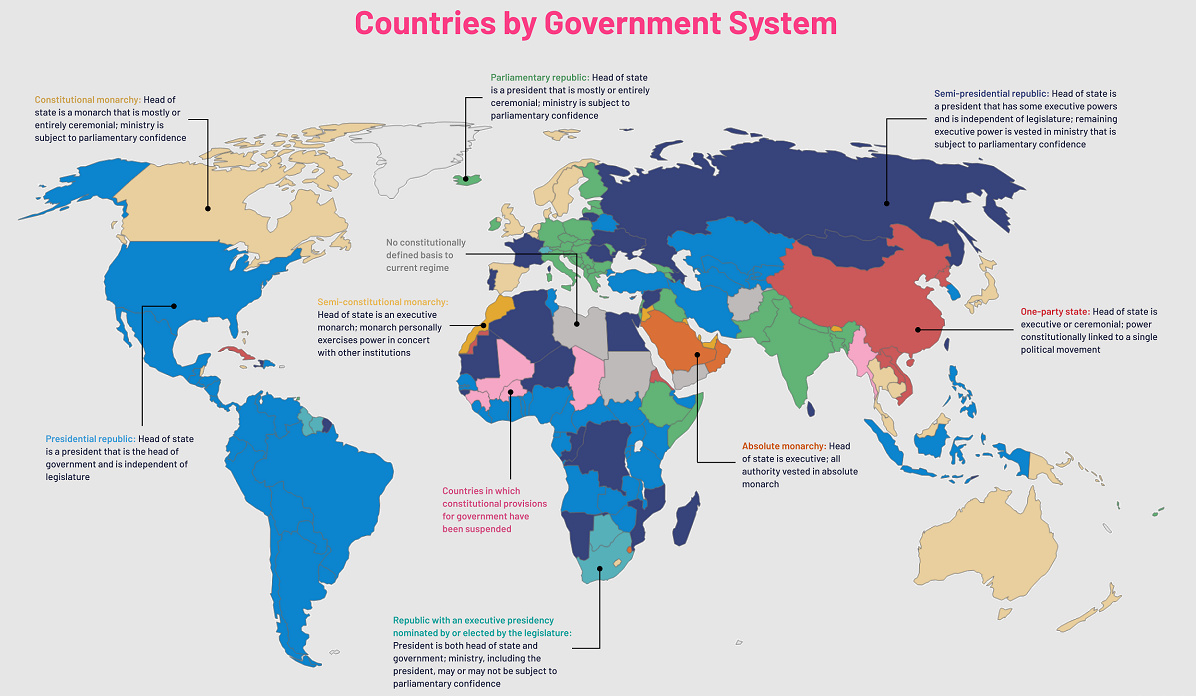
New Orleans did recover in the years after the hurricane. However, as of 2015, the city was still far below its pre-Katrina population. Resettlement has been patchy as well, which is reflected in the towering red peaks of the population map. To explore your city or other parts of the world, visit The Pudding’s interactive map. on Even while political regimes across these countries have changed over time, they’ve largely followed a few different types of governance. Today, every country can ultimately be classified into just nine broad forms of government systems. This map by Truman Du uses information from Wikipedia to map the government systems that rule the world today.
Countries By Type of Government
It’s important to note that this map charts government systems according to each country’s legal framework. Many countries have constitutions stating their de jure or legally recognized system of government, but their de facto or realized form of governance may be quite different. Here is a list of the stated government system of UN member states and observers as of January 2023: Let’s take a closer look at some of these systems.
Monarchies
Brought back into the spotlight after the death of Queen Elizabeth II of England in September 2022, this form of government has a single ruler. They carry titles from king and queen to sultan or emperor, and their government systems can be further divided into three modern types: constitutional, semi-constitutional, and absolute. A constitutional monarchy sees the monarch act as head of state within the parameters of a constitution, giving them little to no real power. For example, King Charles III is the head of 15 Commonwealth nations including Canada and Australia. However, each has their own head of government. On the other hand, a semi-constitutional monarchy lets the monarch or ruling royal family retain substantial political powers, as is the case in Jordan and Morocco. However, their monarchs still rule the country according to a democratic constitution and in concert with other institutions. Finally, an absolute monarchy is most like the monarchies of old, where the ruler has full power over governance, with modern examples including Saudi Arabia and Vatican City.
Republics
Unlike monarchies, the people hold the power in a republic government system, directly electing representatives to form government. Again, there are multiple types of modern republic governments: presidential, semi-presidential, and parliamentary. The presidential republic could be considered a direct progression from monarchies. This system has a strong and independent chief executive with extensive powers when it comes to domestic affairs and foreign policy. An example of this is the United States, where the President is both the head of state and the head of government. In a semi-presidential republic, the president is the head of state and has some executive powers that are independent of the legislature. However, the prime minister (or chancellor or equivalent title) is the head of government, responsible to the legislature along with the cabinet. Russia is a classic example of this type of government. The last type of republic system is parliamentary. In this system, the president is a figurehead, while the head of government holds real power and is validated by and accountable to the parliament. This type of system can be seen in Germany, Italy, and India and is akin to constitutional monarchies. It’s also important to point out that some parliamentary republic systems operate slightly differently. For example in South Africa, the president is both the head of state and government, but is elected directly by the legislature. This leaves them (and their ministries) potentially subject to parliamentary confidence.
One-Party State
Many of the systems above involve multiple political parties vying to rule and govern their respective countries. In a one-party state, also called a single-party state or single-party system, only one political party has the right to form government. All other political parties are either outlawed or only allowed limited participation in elections. In this system, a country’s head of state and head of government can be executive or ceremonial but political power is constitutionally linked to a single political movement. China is the most well-known example of this government system, with the General Secretary of the Communist Party of China ruling as the de facto leader since 1989.
Provisional
The final form of government is a provisional government formed as an interim or transitional government. In this system, an emergency governmental body is created to manage political transitions after the collapse of a government, or when a new state is formed. Often these evolve into fully constitutionalized systems, but sometimes they hold power for longer than expected. Some examples of countries that are considered provisional include Libya, Burkina Faso, and Chad.