But throughout the nation’s history, neither of these numbers have stayed constant. Not only did the population boom as a result of births and immigrants, but the borders of the country kept changing as well – especially in the country’s early years as settlers moved westwards.
U.S. Population Density Over Time
From a big picture perspective, here is how population density has changed for the country as a whole over the last 200 years or so: But today’s animated map, which comes to us from Vivid Maps, takes things a step further. It plots U.S. population density numbers over the time period of 1790-2010 based on U.S. Census data and Jonathan Schroeder’s county-level decadal estimates for population. In essence, it gives a more precise view of who moved where and when over the course of the nation’s history. Note: While U.S. Census data is granular and dates back to 1790, it comes with certain limitations. One obvious drawback, for example, is that such data is not able to properly account for Native American populations.
“Go West, Young Man”
As you might notice in the animation, there is one anomaly that appears in the late-1800s: the area around modern-day Oklahoma is colored in, but the state itself is an “empty gap” on the map. The reason for this? The area was originally designated as Indian Territory – land reserved for the forced re-settlement of Native Americans. However, in 1889, the land was opened up to a massive land rush, and approximately 50,000 pioneers lined up to grab a piece of the two million acres (8,000 km²) opened for settlement. While settlers flocking to Oklahoma is one specific event that ties into this animation, really the map shows the history of a much broader land rush in general: Manifest Destiny. You can see pioneers landing in Louisiana in the early 1800s, the first settlements in California and Oregon, and the gradual filling up of the states in the middle of the country. By the mid-20th century, the distribution of the population starts to resemble that of modern America.
Population Density Today
The average population density in the U.S. is now 92 people per square mile, although this changes dramatically based on where you are located:
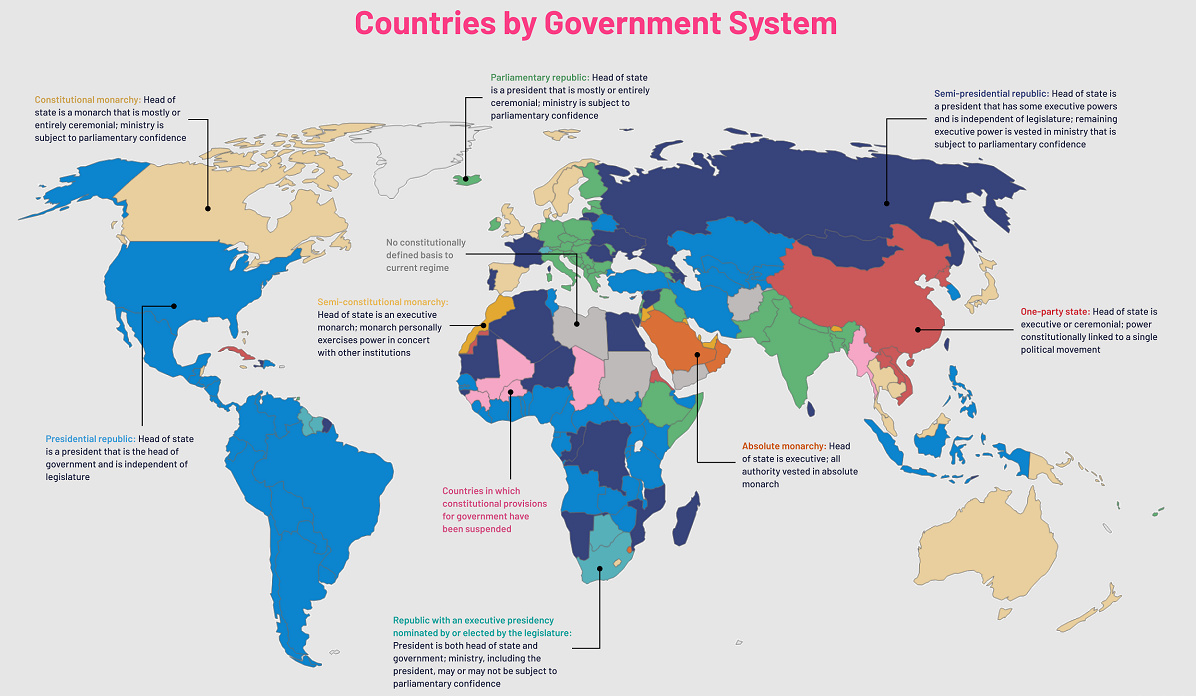
If you are in Alaska, the state with the lowest population density, there is just one person per square mile – but if you’re in New York City there are 27,000 people per square mile, the highest of any major city in the country. on Even while political regimes across these countries have changed over time, they’ve largely followed a few different types of governance. Today, every country can ultimately be classified into just nine broad forms of government systems. This map by Truman Du uses information from Wikipedia to map the government systems that rule the world today.
Countries By Type of Government
It’s important to note that this map charts government systems according to each country’s legal framework. Many countries have constitutions stating their de jure or legally recognized system of government, but their de facto or realized form of governance may be quite different. Here is a list of the stated government system of UN member states and observers as of January 2023: Let’s take a closer look at some of these systems.
Monarchies
Brought back into the spotlight after the death of Queen Elizabeth II of England in September 2022, this form of government has a single ruler. They carry titles from king and queen to sultan or emperor, and their government systems can be further divided into three modern types: constitutional, semi-constitutional, and absolute. A constitutional monarchy sees the monarch act as head of state within the parameters of a constitution, giving them little to no real power. For example, King Charles III is the head of 15 Commonwealth nations including Canada and Australia. However, each has their own head of government. On the other hand, a semi-constitutional monarchy lets the monarch or ruling royal family retain substantial political powers, as is the case in Jordan and Morocco. However, their monarchs still rule the country according to a democratic constitution and in concert with other institutions. Finally, an absolute monarchy is most like the monarchies of old, where the ruler has full power over governance, with modern examples including Saudi Arabia and Vatican City.
Republics
Unlike monarchies, the people hold the power in a republic government system, directly electing representatives to form government. Again, there are multiple types of modern republic governments: presidential, semi-presidential, and parliamentary. The presidential republic could be considered a direct progression from monarchies. This system has a strong and independent chief executive with extensive powers when it comes to domestic affairs and foreign policy. An example of this is the United States, where the President is both the head of state and the head of government. In a semi-presidential republic, the president is the head of state and has some executive powers that are independent of the legislature. However, the prime minister (or chancellor or equivalent title) is the head of government, responsible to the legislature along with the cabinet. Russia is a classic example of this type of government. The last type of republic system is parliamentary. In this system, the president is a figurehead, while the head of government holds real power and is validated by and accountable to the parliament. This type of system can be seen in Germany, Italy, and India and is akin to constitutional monarchies. It’s also important to point out that some parliamentary republic systems operate slightly differently. For example in South Africa, the president is both the head of state and government, but is elected directly by the legislature. This leaves them (and their ministries) potentially subject to parliamentary confidence.
One-Party State
Many of the systems above involve multiple political parties vying to rule and govern their respective countries. In a one-party state, also called a single-party state or single-party system, only one political party has the right to form government. All other political parties are either outlawed or only allowed limited participation in elections. In this system, a country’s head of state and head of government can be executive or ceremonial but political power is constitutionally linked to a single political movement. China is the most well-known example of this government system, with the General Secretary of the Communist Party of China ruling as the de facto leader since 1989.
Provisional
The final form of government is a provisional government formed as an interim or transitional government. In this system, an emergency governmental body is created to manage political transitions after the collapse of a government, or when a new state is formed. Often these evolve into fully constitutionalized systems, but sometimes they hold power for longer than expected. Some examples of countries that are considered provisional include Libya, Burkina Faso, and Chad.