It’s well known that a correction can occur at any time, and the fear of market crashes can make even the most seasoned investors to make questionable decisions. While it’s true that putting your money on the line is never easy, the historical record of the stock market is virtually irrefutable: U.S. markets have consistently performed over long holding periods, even going back to the 19th century.
Market Performance (1872-2018)
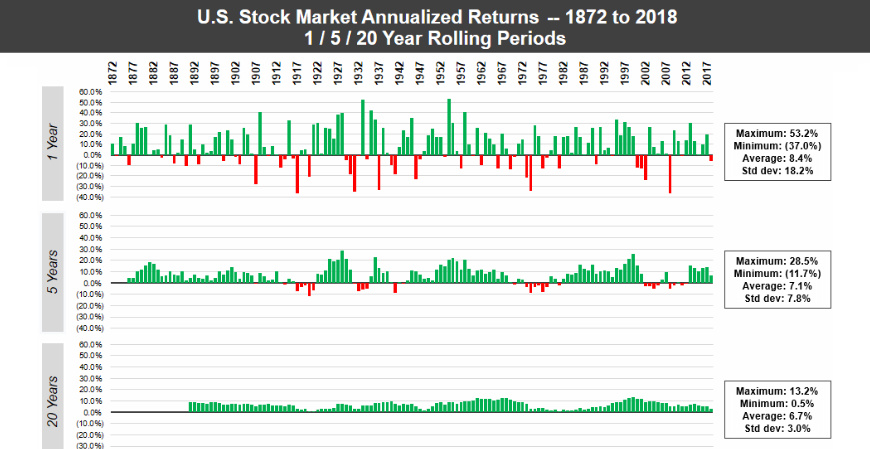
Today’s animation comes to us from The Measure of a Plan, and it shows the performance of the U.S. market over different rolling time horizons using annualized returns. Note: The animation uses real total returns from the S&P Composite Index from 1872 to 1957, and then the S&P 500 Index from 1957 onwards. Data has been adjusted for reinvestment of dividends as well as inflation.
Using just one-year intervals of time, the market can be a crapshoot. Unfortunately, if you were to just choose a one-year period at random, there would be a significant chance of losing money. However, as the timeframes get longer – the animation goes to 5-year, 10-year, and then 20-year rolling periods – the frequency of losses rapidly decreases. By the time you get to the 20-year windows, there isn’t a single instance in which the market had a negative return.
Why Time Matters
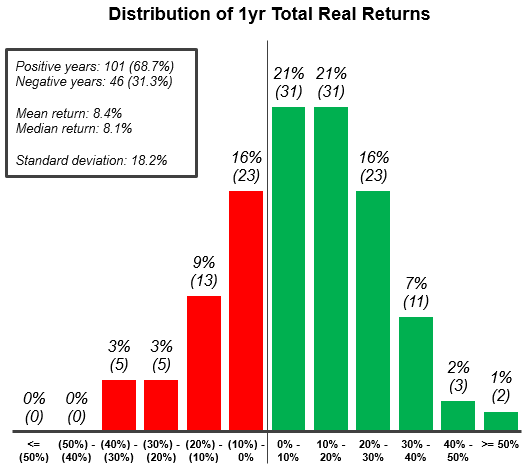
Over 146 years of data, the chance of seeing negative returns for any given year is about 31%. That fact in itself is quite alarming, but even more important to note is the distribution of returns in those down years. As you can see in the following chart also from The Measure of a Plan, it’s not uncommon for a down year to skew in the high negatives, just as it did during the crisis of 2008:
According to the data, there have been 10 individual years where the market has lost upwards of 20% – and while those off years are greatly outnumbered by the years with positive returns, it makes it clear that timeframe matters. Past performance obviously doesn’t guarantee future results, but the historical track record in this case is quite robust. Long-term investors can see that as long as their time horizon is measured in the decades, you can take the odds of making money in the stock market to the bank. on These are in the form of Treasury securities, some of the most liquid assets worldwide. Central banks use them for foreign exchange reserves and private investors flock to them during flights to safety thanks to their perceived low default risk. Beyond these reasons, foreign investors may buy Treasuries as a store of value. They are often used as collateral during certain international trade transactions, or countries can use them to help manage exchange rate policy. For example, countries may buy Treasuries to protect their currency’s exchange rate from speculation. In the above graphic, we show the foreign holders of the U.S. national debt using data from the U.S. Department of the Treasury.
Top Foreign Holders of U.S. Debt
With $1.1 trillion in Treasury holdings, Japan is the largest foreign holder of U.S. debt. Japan surpassed China as the top holder in 2019 as China shed over $250 billion, or 30% of its holdings in four years. This bond offloading by China is the one way the country can manage the yuan’s exchange rate. This is because if it sells dollars, it can buy the yuan when the currency falls. At the same time, China doesn’t solely use the dollar to manage its currency—it now uses a basket of currencies. Here are the countries that hold the most U.S. debt: As the above table shows, the United Kingdom is the third highest holder, at over $655 billion in Treasuries. Across Europe, 13 countries are notable holders of these securities, the highest in any region, followed by Asia-Pacific at 11 different holders. A handful of small nations own a surprising amount of U.S. debt. With a population of 70,000, the Cayman Islands own a towering amount of Treasury bonds to the tune of $284 billion. There are more hedge funds domiciled in the Cayman Islands per capita than any other nation worldwide. In fact, the four smallest nations in the visualization above—Cayman Islands, Bermuda, Bahamas, and Luxembourg—have a combined population of just 1.2 million people, but own a staggering $741 billion in Treasuries.
Interest Rates and Treasury Market Dynamics
Over 2022, foreign demand for Treasuries sank 6% as higher interest rates and a strong U.S. dollar made owning these bonds less profitable. This is because rising interest rates on U.S. debt makes the present value of their future income payments lower. Meanwhile, their prices also fall. As the chart below shows, this drop in demand is a sharp reversal from 2018-2020, when demand jumped as interest rates hovered at historic lows. A similar trend took place in the decade after the 2008-09 financial crisis when U.S. debt holdings effectively tripled from $2 to $6 trillion.
Driving this trend was China’s rapid purchase of Treasuries, which ballooned from $100 billion in 2002 to a peak of $1.3 trillion in 2013. As the country’s exports and output expanded, it sold yuan and bought dollars to help alleviate exchange rate pressure on its currency. Fast-forward to today, and global interest-rate uncertainty—which in turn can impact national currency valuations and therefore demand for Treasuries—continues to be a factor impacting the future direction of foreign U.S. debt holdings.