They’ll write about the battle between nationalism and globalism, soaring global debt, a dysfunctional healthcare system, societal concerns around automation and AI, and pushback on immigration. They will also note the growing number of populist leaders in Western democracies, ranging from Marine Le Pen to Donald Trump. However, these historians will not view these ideas and events in isolation. Instead, they will link them all, at least partially, to an overarching trend that is intimately connected to today’s biggest problems: the “hollowing out” of the middle class.
Visualizing the Collapse of the Middle Class
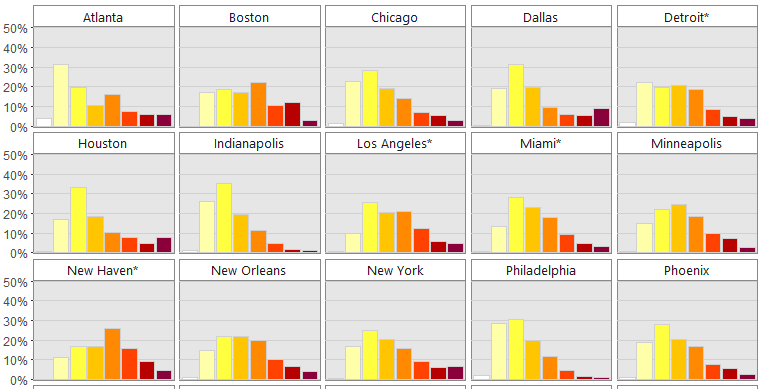
The fact is many people have less money in their pockets – and understandably, this has motivated people to take action against the status quo. And while the collapse of the middle class and income inequality are issues that receive a fair share of discussion, we thought that this particular animation from Metrocosm helped to put things in perspective. The following animation shows the change in income distribution in 20 major U.S. cities between 1970 and 2015:
The differences between 1970 and 2015 are intense. At first, each distribution is more bell-shaped, with the majority of people in a middle income bracket – and by 2015, those people are “pushed” out towards the extremes as they either get richer or poorer.
A Broader Look at Income Inequality
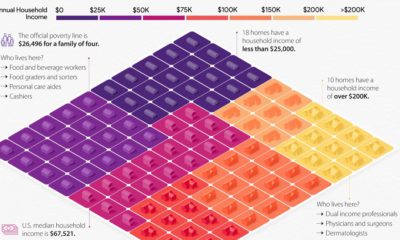
This phenomenon is not limited to major cities, either. Here’s another look at the change in income distribution using smaller brackets and the whole U.S. adult population:
Courtesy of: FT (h/t Metrocosm) It’s a multi-faceted challenge, because while a significant portion of middle class households are being shifted into lower income territory, there are also many households that are doing the opposite. According to Pew Research, the percentage of households in the upper income bracket has grown from 14% to 21% between 1971 and 2015. The end result? With people being pushed to both ends of the spectrum, the middle class has decreased considerably in size. In 1971, the middle class made up 61% of the adult population, and by 2014 it accounted for less than 50%. As this “core” of society shrinks, it aggravates the aforementioned problems. People and governments borrow more money to make up for a lack of middle class wealth, while backlashes against globalism, free trade, and open borders are fueled. The populists who can “fix” the broken system are elected, and so on. on To see how the minimum wage differs around the world, we’ve visualized data from Picodi, which includes values for 67 countries as of January 2023.
Monthly Minimum Wage, by Country
The following table includes all of the data used in this infographic. Each value represents the monthly minimum wage a full-time worker would receive in each country. Picodi states that these figures are net of taxes and have been converted to USD. Generally speaking, developed countries have a higher cost of living, and thus require a higher minimum wage. Two outliers in this dataset are Argentina and Turkey, which have increased their minimum wages by 100% or more from January 2022 levels. Turkey is suffering from an ongoing currency crisis, with the lira losing over 40% of its value in 2021. Prices of basic goods have increased considerably as the Turkish lira continues to plummet. In fact, a 2022 survey found that 70% of people in Turkey were struggling to pay for food. Argentina, South America’s second-biggest economy, is also suffering from very high inflation. In response, the country announced three minimum wage increases throughout 2022.
Minimum Wage in the U.S.
Within the U.S., minimum wage varies significantly by state. We’ve visualized each state’s basic minimum rate (hourly) using January 2023 data from the U.S. Department of Labor.
2023-03-17 Update: This map was updated to fix several incorrect values. We apologize for any confusion this may have caused. America’s federal minimum wage has remained unchanged since 2009 at $7.25 per hour. Each state is allowed to set their own minimum wage, as long as it’s higher than the federal minimum. In states that do not set their own minimum, the federal minimum applies. If we assume someone works 40 hours a week, the federal minimum wage of $7.25 translates to an annual figure of just $15,080 before taxes. California’s minimum wage of $15.50 translates to $32,240 before taxes. For further perspective, check out our 2022 infographic on the salary needed to buy a home across 50 U.S. cities.