Black Swans: Short-term Crisis, Long-term Opportunity
Few investors could have predicted that a viral outbreak would end the longest-running bull market in U.S. history. Now, the COVID-19 pandemic has pushed stocks far into bear market territory. From its peak on February 19th, the S&P 500 has fallen almost 30%. While this volatility can cause investors to panic, it’s helpful to keep a long-term perspective. Black swan events, which are defined as rare and unexpected events with severe consequences, have come and gone throughout history. In today’s Markets in a Minute chart from New York Life Investments, we explore the sell-off size and recovery length for some of these events.
Wars, Viruses, and Excessive Valuations
With sell-offs ranging from -5% to -50%, black swan events have all impacted the S&P 500 differently. Here’s a look at select events over the last half-century:
- Figure as of market close on March 18, 2020. The sell-off measures from the market high to the market low. While the declines can be severe, most have been short-lived. Markets typically returned to previous peak levels in no more than a couple of months. The Oil Embargo, Black Monday, and the Global Financial Crisis are notable outliers, with the recovery spanning a year or more. After Black Monday, the Federal Reserve reaffirmed its readiness to provide liquidity, and the market recovered in about 400 trading days. Both the 1973 Oil Embargo and 2007 Global Financial Crisis led to U.S. recessions, lengthening the recovery over multiple years.
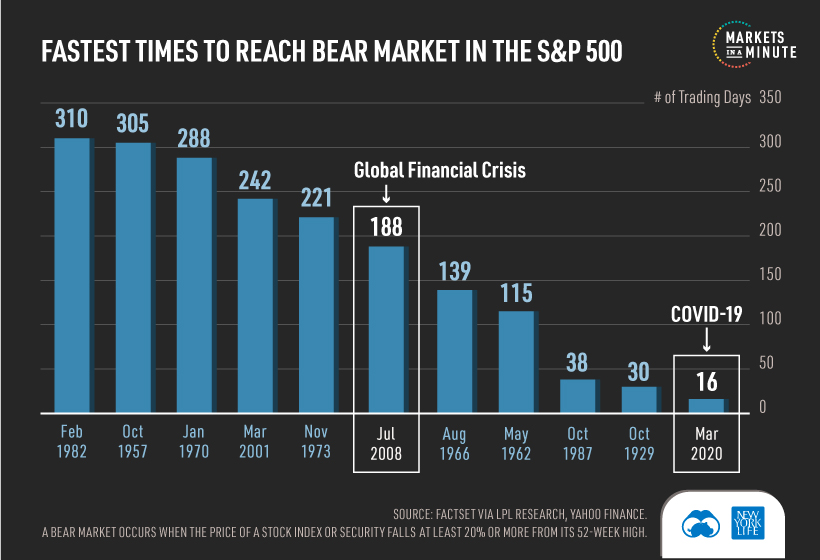
COVID-19: How Long Will it Last?
It’s difficult to predict how long COVID-19 will impact markets, as its societal and financial disruption is unprecedented. In fact, the S&P 500 reached a bear market in just 16 days, the fastest time period on record.
Some Wall Street strategists believe that the market will only begin to recover when COVID-19’s daily infection rate peaks. In the meantime, governments have begun announcing rate cuts and fiscal stimulus in order to help stabilize the economy. Considering the high levels of uncertainty, what should investors do?
Buy on Fear, Sell on Greed?
Legendary investor Warren Buffet is a big proponent of this strategy. When others are greedy—typically when prices are boiling over—assets may be overpriced. On the flipside, there may be good buying opportunities when others are fearful. Most importantly, investors need to remain disciplined with their investment process throughout the volatility. History has shown that markets will eventually recover, and may reward patient investors. Note: This post originally came from our Advisor Channel, a partnership with New York Life Investments that aims to create a go-to resource for financial advisors and their clients to navigate market trends. on Last year, stock and bond returns tumbled after the Federal Reserve hiked interest rates at the fastest speed in 40 years. It was the first time in decades that both asset classes posted negative annual investment returns in tandem. Over four decades, this has happened 2.4% of the time across any 12-month rolling period. To look at how various stock and bond asset allocations have performed over history—and their broader correlations—the above graphic charts their best, worst, and average returns, using data from Vanguard.
How Has Asset Allocation Impacted Returns?
Based on data between 1926 and 2019, the table below looks at the spectrum of market returns of different asset allocations:
We can see that a portfolio made entirely of stocks returned 10.3% on average, the highest across all asset allocations. Of course, this came with wider return variance, hitting an annual low of -43% and a high of 54%.
A traditional 60/40 portfolio—which has lost its luster in recent years as low interest rates have led to lower bond returns—saw an average historical return of 8.8%. As interest rates have climbed in recent years, this may widen its appeal once again as bond returns may rise.
Meanwhile, a 100% bond portfolio averaged 5.3% in annual returns over the period. Bonds typically serve as a hedge against portfolio losses thanks to their typically negative historical correlation to stocks.
A Closer Look at Historical Correlations
To understand how 2022 was an outlier in terms of asset correlations we can look at the graphic below:
The last time stocks and bonds moved together in a negative direction was in 1969. At the time, inflation was accelerating and the Fed was hiking interest rates to cool rising costs. In fact, historically, when inflation surges, stocks and bonds have often moved in similar directions. Underscoring this divergence is real interest rate volatility. When real interest rates are a driving force in the market, as we have seen in the last year, it hurts both stock and bond returns. This is because higher interest rates can reduce the future cash flows of these investments. Adding another layer is the level of risk appetite among investors. When the economic outlook is uncertain and interest rate volatility is high, investors are more likely to take risk off their portfolios and demand higher returns for taking on higher risk. This can push down equity and bond prices. On the other hand, if the economic outlook is positive, investors may be willing to take on more risk, in turn potentially boosting equity prices.
Current Investment Returns in Context
Today, financial markets are seeing sharp swings as the ripple effects of higher interest rates are sinking in. For investors, historical data provides insight on long-term asset allocation trends. Over the last century, cycles of high interest rates have come and gone. Both equity and bond investment returns have been resilient for investors who stay the course.