Black Swan Risks Heading into 2016 [Chart]
SocGen’s latest evaluation still sees steep downside risk to market
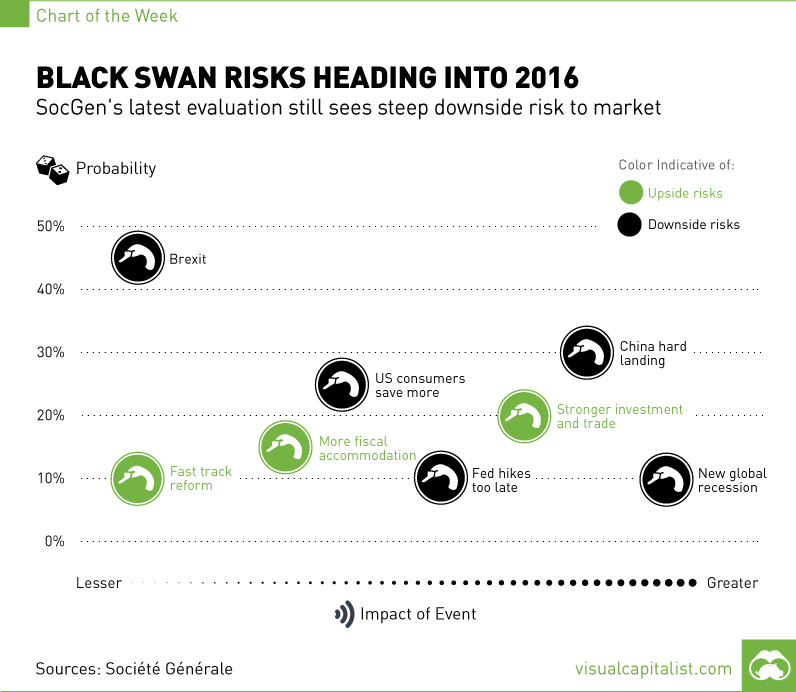
The Chart of the Week is a weekly Visual Capitalist feature on Fridays. Société Générale has come out with their most recent list of what the bank considers to be potential “black swans” to the market. France’s third largest bank publishes this list as part of their Global Economic Outlook. As several users have pointed out in the past, we are indeed aware that black swans are by nature unlikely and extremely difficult to predict. We agree with this, but we do find SocGen’s list a useful way of understanding some of the upcoming risks in the market that could sway investor sentiment and opinion. In the latest edition of the report, which was published this week, the bank still sees an excess of potential downside risks to the global economy. The greatest of these risks, slated at only a 10% probability but with maximum impact potential, is a new global recession. The report mentions as well that a hard landing in China could have similar effects. Downside risks and their probability:
45% – Great Britain leaves the EU (Impact: low) 30% – China’s economy has a hard landing (Impact: high) 25% – U.S. consumers save more than expected (Impact: medium) 10% – Fed hikes too late (Impact: medium to high) 10% – New global recession (Impact: high)
Upside risks and their probability:
20% – Stronger investment and trade (Impact: medium to high) 15% – More fiscal accommodation (Impact: medium) 10% – Fast track reform (Impact: low)
One risk that could be added to the mix is some sort of a deflationary spiral. These are words that no central banker wants to hear, but signs of deflation are popping up all over the market. For example, as we showed in a recent chart, nearly all commodities got hammered over 2015. The impact of such a spiral would be catastrophic, and the Fed has limited means to combat such an event. That said, it is tough to discern whether deflation will continue to be found sprinkled benignly throughout the economy, or if it could somehow snowball into the full-on death spiral. Black swan indeed.
on Today’s chart measures the extent to which 41 major economies are reopening, by plotting two metrics for each country: the mobility rate and the COVID-19 recovery rate: Data for the first measure comes from Google’s COVID-19 Community Mobility Reports, which relies on aggregated, anonymous location history data from individuals. Note that China does not show up in the graphic as the government bans Google services. COVID-19 recovery rates rely on values from CoronaTracker, using aggregated information from multiple global and governmental databases such as WHO and CDC.
Reopening Economies, One Step at a Time
In general, the higher the mobility rate, the more economic activity this signifies. In most cases, mobility rate also correlates with a higher rate of recovered people in the population. Here’s how these countries fare based on the above metrics. Mobility data as of May 21, 2020 (Latest available). COVID-19 case data as of May 29, 2020. In the main scatterplot visualization, we’ve taken things a step further, assigning these countries into four distinct quadrants:
1. High Mobility, High Recovery
High recovery rates are resulting in lifted restrictions for countries in this quadrant, and people are steadily returning to work. New Zealand has earned praise for its early and effective pandemic response, allowing it to curtail the total number of cases. This has resulted in a 98% recovery rate, the highest of all countries. After almost 50 days of lockdown, the government is recommending a flexible four-day work week to boost the economy back up.
2. High Mobility, Low Recovery
Despite low COVID-19 related recoveries, mobility rates of countries in this quadrant remain higher than average. Some countries have loosened lockdown measures, while others did not have strict measures in place to begin with. Brazil is an interesting case study to consider here. After deferring lockdown decisions to state and local levels, the country is now averaging the highest number of daily cases out of any country. On May 28th, for example, the country had 24,151 new cases and 1,067 new deaths.
3. Low Mobility, High Recovery
Countries in this quadrant are playing it safe, and holding off on reopening their economies until the population has fully recovered. Italy, the once-epicenter for the crisis in Europe is understandably wary of cases rising back up to critical levels. As a result, it has opted to keep its activity to a minimum to try and boost the 65% recovery rate, even as it slowly emerges from over 10 weeks of lockdown.
4. Low Mobility, Low Recovery
Last but not least, people in these countries are cautiously remaining indoors as their governments continue to work on crisis response. With a low 0.05% recovery rate, the United Kingdom has no immediate plans to reopen. A two-week lag time in reporting discharged patients from NHS services may also be contributing to this low number. Although new cases are leveling off, the country has the highest coronavirus-caused death toll across Europe. The U.S. also sits in this quadrant with over 1.7 million cases and counting. Recently, some states have opted to ease restrictions on social and business activity, which could potentially result in case numbers climbing back up. Over in Sweden, a controversial herd immunity strategy meant that the country continued business as usual amid the rest of Europe’s heightened regulations. Sweden’s COVID-19 recovery rate sits at only 13.9%, and the country’s -93% mobility rate implies that people have been taking their own precautions.
COVID-19’s Impact on the Future
It’s important to note that a “second wave” of new cases could upend plans to reopen economies. As countries reckon with these competing risks of health and economic activity, there is no clear answer around the right path to take. COVID-19 is a catalyst for an entirely different future, but interestingly, it’s one that has been in the works for a while. —Carmen Reinhart, incoming Chief Economist for the World Bank Will there be any chance of returning to “normal” as we know it?