If you follow the news, the world can seem pretty grim at times. This pessimistic view of global affairs is common. We’ve been trained by the media to believe that things are always getting worse – and not surprisingly, people extrapolate these perceptions onto issues like poverty. One survey in the U.K. is the perfect barometer for this kind of public pessimism: in 2016 an Oxfam poll found that 87% of people thought that global poverty was staying the same or getting worse. However, the reality couldn’t be further from those perceptions.
Poverty in Perspective
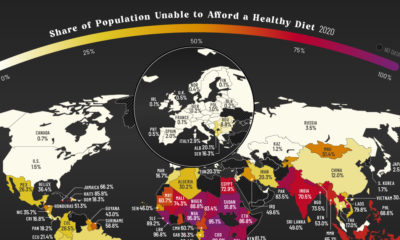
The World Bank announced this week that extreme poverty is at its lowest rate in 28 years. The current estimate is that 8.6% of the global population now lives in extreme poverty, using a measure based on a $1.90 per day wage (in 2011 PPP). The figure is adjusted using the cost of living and inflation, and it also takes into account the minimum needed for daily essentials in places where poverty is prevalent. For comparison, in 1990, more than 1.9 billion people (36% of global population) lived below the extreme poverty line. That means more than one billion people have come out of poverty since then.
Recent Data
The preceding context is powerful, but where are we today in the fight against extreme poverty? According to the World Bank’s latest comprehensive numbers that were just released for 2015, here is the latest data by region: As you can see, just over 85% of the population in extreme poverty is living in the Sub-Saharan Africa and South Asia regions. It’s worth noting that both of these regions are also rapidly growing in terms of population, as well. Finally, here’s a look at recent progress during the period of 2013-2015: The one anomaly above (Middle East and North Africa) is a result of wars in Syria and Yemen – however, as you can see, the region did previously hit a low under 3%. Overall, as the data shows, there has been progress in the fight against extreme poverty in both the long and short terms. That said, experts do warn that the rate of poverty reduction is slowing in more recent years, which will make the trend harder to keep intact.
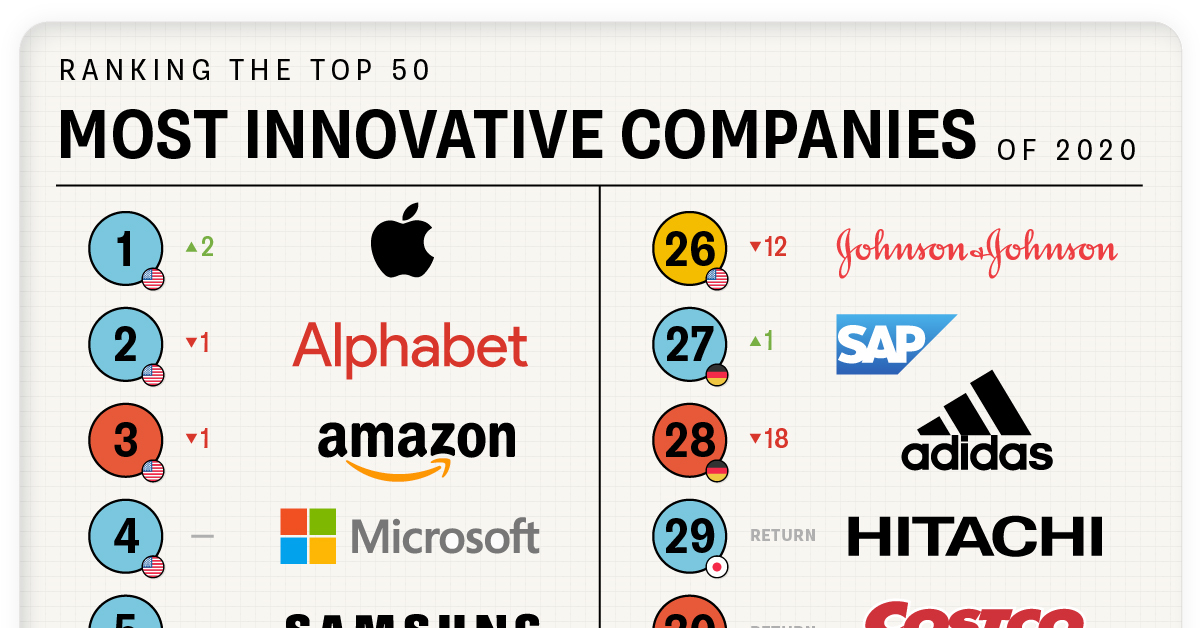
on In today’s fast-paced world, companies need to stay relevant in order to survive. Because of this, it’s become increasingly more important for businesses to prioritize innovation. This chart looks at the top 50 most innovative companies in 2020, based on a survey by Boston Consulting Group (BCG). The companies have been ranked based on four variables:
Global “Mindshare”: The number of votes from all innovation executives. Industry Peer Review: The number of votes from executives in a company’s industry. Industry Disruption: A diversity index to measure votes across industries. Value Creation: Total share return.
Breakdown of the Leaderboard
BCG has been ranking the most innovative companies since 2005. Here’s a look at the top 50 most innovative companies in 2020: When you think about innovative companies, Walmart might not be top of mind. However, the retail giant has moved up to the 13th spot on the list, an increase of 29 places since 2019. Walmart has put significant efforts into its e-commerce and omnichannel offerings. For instance, the company launched NextDay Delivery in 2020, and now offers one-day delivery to a majority of the U.S. population. The company also has a stake in the Chinese e-commerce platform JD.com, which has grown from 5% to 12%. Costco makes it to 30th place this year, and the company is known for its effective use of data. Thanks to the company’s members-only model, it has been able to compile a ton of information on its customers. It uses this data not only for marketing purposes, but to help streamline processes like recall notices. Costco also uses data monitoring sensors in its warehouses to save money on water usage and to spot any potential leaks before they happen. Another company worth touching on is Huawei—the Chinese tech company has taken the 6th spot, a 42 rank increase since 2019. This rise in the ranks is likely due to the company’s significant $19 billion investment in research and development (R&D) in 2019. These types of investments seem to be paying off, as Huawei sold more smartphones in 2019 than Apple.
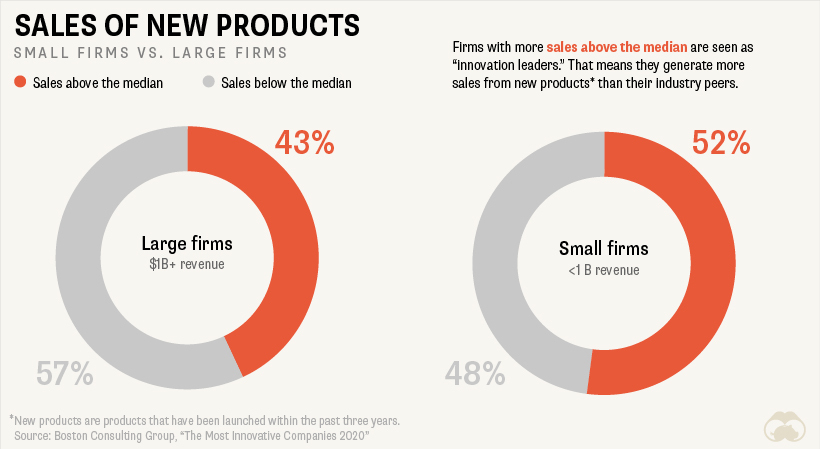
Innovation Leaders Come in All Sizes
While people may picture startups when they think of innovation and adaptability, big firms aren’t lagging far behind when it comes to innovation output. In this context, firms with new product sales above their industry median are considered “innovation leaders.” Although 52% of small firms are considered innovation leaders, 43% of large firms still find themselves in the same boat.
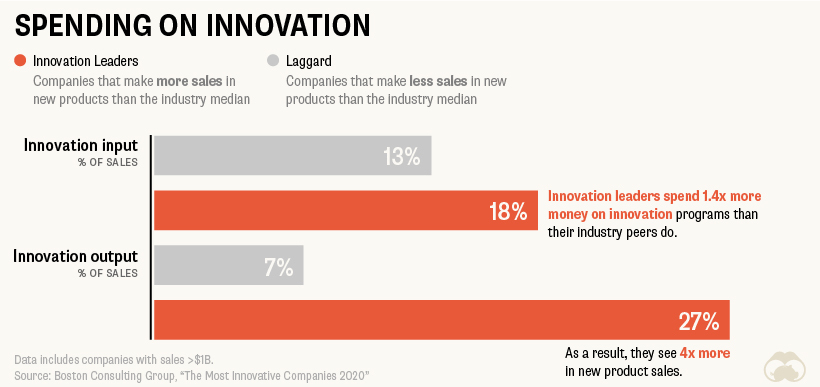
In fact, because larger firms generally have more access to resources and manpower than smaller firms, they often have an advantage when it comes to research and development and the creation of innovation-focused programs. Investing in innovation shows a far greater payoff down the line—firms that invested 1.4x more in innovation input saw 4x the amount of new products sales.
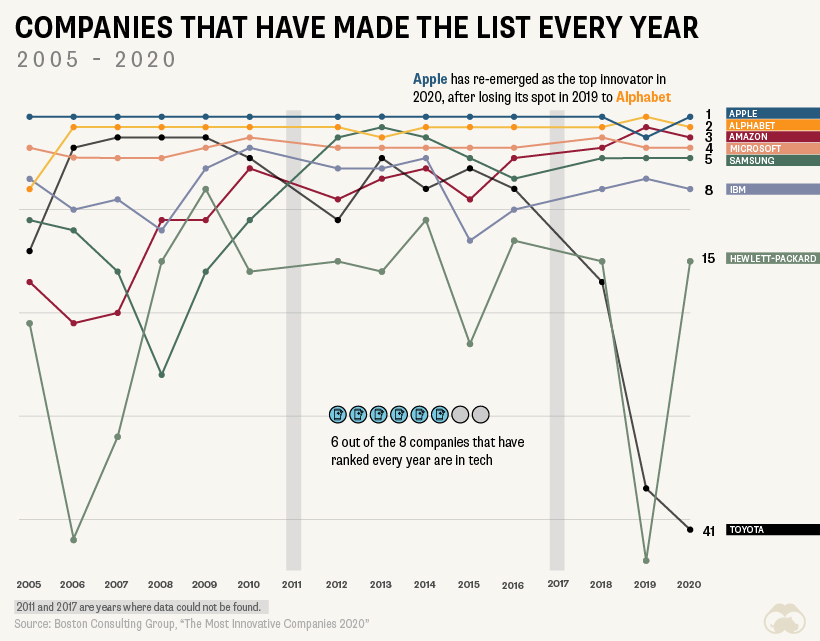
Innovation as a Lifestyle
Unless you’re in a startup that’s hoping to get acquired by a larger firm, innovation can’t be a one-hit-wonder. Yet, despite its importance, innovation over the long term is hard to maintain. There have only been 8 companies that have appeared on the list every year. Here’s a look at the companies that have consistently made the cut since 2005:
These companies are serial innovators, and have managed to create innovation systems to perpetually foster creativity and agility. It’s an intentional, laborious process—but when done right, the payoff can be huge.