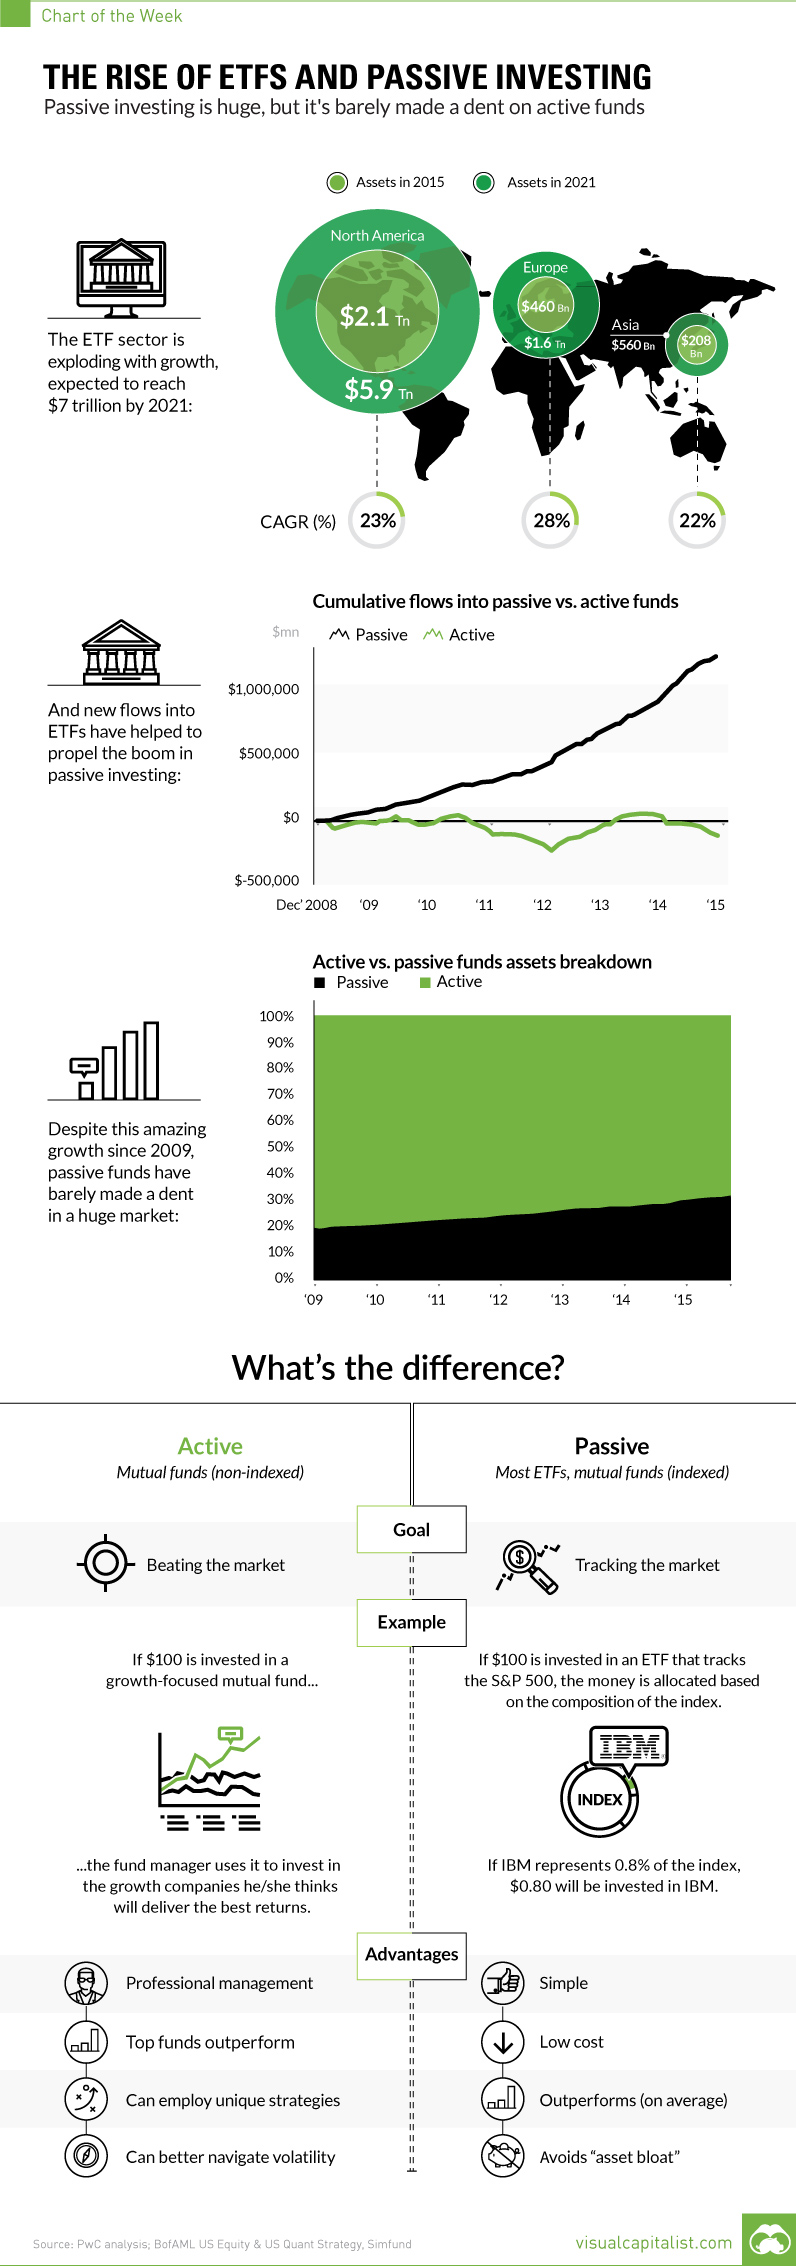
Rise of ETFs and Passive Investing
Passive investing is huge, but it’s barely made a dent on active
The Chart of the Week is a weekly Visual Capitalist feature on Fridays. For the investing world, the meteoric rise of ETFs, or exchange-traded funds, has been a key story to follow since the 2008 crisis. The ETF landscape has changed dramatically over that timeframe. In 2007, there were 1,181 ETFs that existed worldwide. By 2015, that number sailed to 4,396 – that’s a lot of new ETFs. Today, there is so much selection out there that you can do pretty much everything. Want to go 2x short oil? Then try the ProShares UltraShort Bloomberg Crude Oil ETF (SCO). Want to buy into the cybersecurity boom? Try the PureFunds Cybersecurity ETF (HACK). Want to focus in on a specific geographic region such as Singapore? Don’t worry, the iShares MSCI Singapore ETF (EWS) gets you precise exposure to large and mid-sized Singaporean companies. You get the idea.
Part of a Bigger Trend
Even though the global ETF market is estimated to be worth $7 trillion by 2021, the ETF craze is actually part of a much bigger trend towards putting money into passive funds. Passive funds aim to “track” a specific market, by allocating dollars in equal proportion to an index. This is in contrast to active funds, which employ professional managers who try to beat the market by having more discretion in choosing which securities make up a portfolio. The vast majority of ETFs fit in the former category, and passive investing has been on a roll since the Financial Crisis. In 2015, for example, $413.8 billion was poured into passive funds, while $207.3 billion was pulled out of U.S. mutual funds with active management.
Passive or Active?
Why have ETFs and passive investing been so popular? In general, it is because many active managers have struggled to beat the market as a whole in recent years. However, there are some important caveats worth considering. First, while most managers fail to beat the market, some of them do succeed. Financial planners will be the first to tell you that there are revered mutual funds out there that do often perform to the upside. Next, passive funds have also profited off of the extreme and unprecedented actions taken by central banks. Since the crisis, central banks have experimented by pumping trillions of dollars of liquidity into the system, creating a very unusual market situation. With the cost of borrowing at record lows, valuations have become extremely distorted in the market. This careful balancing act by central banks benefits passive investors until it blows up. Lastly, low volatility by definition means smaller price movements that active managers can capitalize on. If the volatility environment changes, passive funds may lose a level of attractiveness as there are more winners and losers at any given time. on These are in the form of Treasury securities, some of the most liquid assets worldwide. Central banks use them for foreign exchange reserves and private investors flock to them during flights to safety thanks to their perceived low default risk. Beyond these reasons, foreign investors may buy Treasuries as a store of value. They are often used as collateral during certain international trade transactions, or countries can use them to help manage exchange rate policy. For example, countries may buy Treasuries to protect their currency’s exchange rate from speculation. In the above graphic, we show the foreign holders of the U.S. national debt using data from the U.S. Department of the Treasury.
Top Foreign Holders of U.S. Debt
With $1.1 trillion in Treasury holdings, Japan is the largest foreign holder of U.S. debt. Japan surpassed China as the top holder in 2019 as China shed over $250 billion, or 30% of its holdings in four years. This bond offloading by China is the one way the country can manage the yuan’s exchange rate. This is because if it sells dollars, it can buy the yuan when the currency falls. At the same time, China doesn’t solely use the dollar to manage its currency—it now uses a basket of currencies. Here are the countries that hold the most U.S. debt: As the above table shows, the United Kingdom is the third highest holder, at over $655 billion in Treasuries. Across Europe, 13 countries are notable holders of these securities, the highest in any region, followed by Asia-Pacific at 11 different holders. A handful of small nations own a surprising amount of U.S. debt. With a population of 70,000, the Cayman Islands own a towering amount of Treasury bonds to the tune of $284 billion. There are more hedge funds domiciled in the Cayman Islands per capita than any other nation worldwide. In fact, the four smallest nations in the visualization above—Cayman Islands, Bermuda, Bahamas, and Luxembourg—have a combined population of just 1.2 million people, but own a staggering $741 billion in Treasuries.
Interest Rates and Treasury Market Dynamics
Over 2022, foreign demand for Treasuries sank 6% as higher interest rates and a strong U.S. dollar made owning these bonds less profitable. This is because rising interest rates on U.S. debt makes the present value of their future income payments lower. Meanwhile, their prices also fall. As the chart below shows, this drop in demand is a sharp reversal from 2018-2020, when demand jumped as interest rates hovered at historic lows. A similar trend took place in the decade after the 2008-09 financial crisis when U.S. debt holdings effectively tripled from $2 to $6 trillion.
Driving this trend was China’s rapid purchase of Treasuries, which ballooned from $100 billion in 2002 to a peak of $1.3 trillion in 2013. As the country’s exports and output expanded, it sold yuan and bought dollars to help alleviate exchange rate pressure on its currency. Fast-forward to today, and global interest-rate uncertainty—which in turn can impact national currency valuations and therefore demand for Treasuries—continues to be a factor impacting the future direction of foreign U.S. debt holdings.