Today’s visualization uses data primarily from the United Nations Statistics Division (UNSD) to rank the world’s countries by their share of Earth’s surface.
Breakdown of Countries Share of Earth’s Surface
The largest countries by surface area are Russia (3.35%), Canada (1.96%), and China (1.88%). Together they occupy roughly 7.2% of Earth’s surface. Russia is so big that even if we divided the country between its Asian and European sections, those new regions would still be the largest in their respective continents. Antarctica, although not a country, covers the second largest amount of land overall at 2.75%. Meanwhile, the other nations that surpass the 1% mark for surface area include the United States (1.87%), Brazil (1.67%), and Australia (1.51%). The remaining 195 countries and regions below 1%, combined, account for the other half of Earth’s land surface. Among the world’s smallest countries are the island nations of the Caribbean and the South Pacific Ocean. However, the tiniest of the tiny are Vatican City and Monaco, which combine for a total area of just 2.51 km². The remaining 70% of Earth’s surface is water: 27% territorial waters and 43% international waters or areas beyond national jurisdiction.
Areas Beyond National Jurisdiction
In the past, nations adhered to the freedom-of-the-seas doctrine, a 17th century principle that limited jurisdiction over the oceans to a narrow area along a nation’s coastline. The rest of the seas did not belong to any nation and were free for countries to travel and exploit.
This situation lasted into the 20th century, but by mid-century there was an effort to extend national claims as competition for offshore resources became increasingly fierce and ocean pollution became an issue.
In 1982, the United Nations adopted the Law of the Sea Convention which extended international law over the extra-territorial waters. The convention established freedom-of-navigation rights and set territorial sea boundaries 12 miles (19 km) offshore with exclusive economic zones up to 200 miles (322 km) offshore, extending a country’s influence over maritime resources.
Does Size Matter?
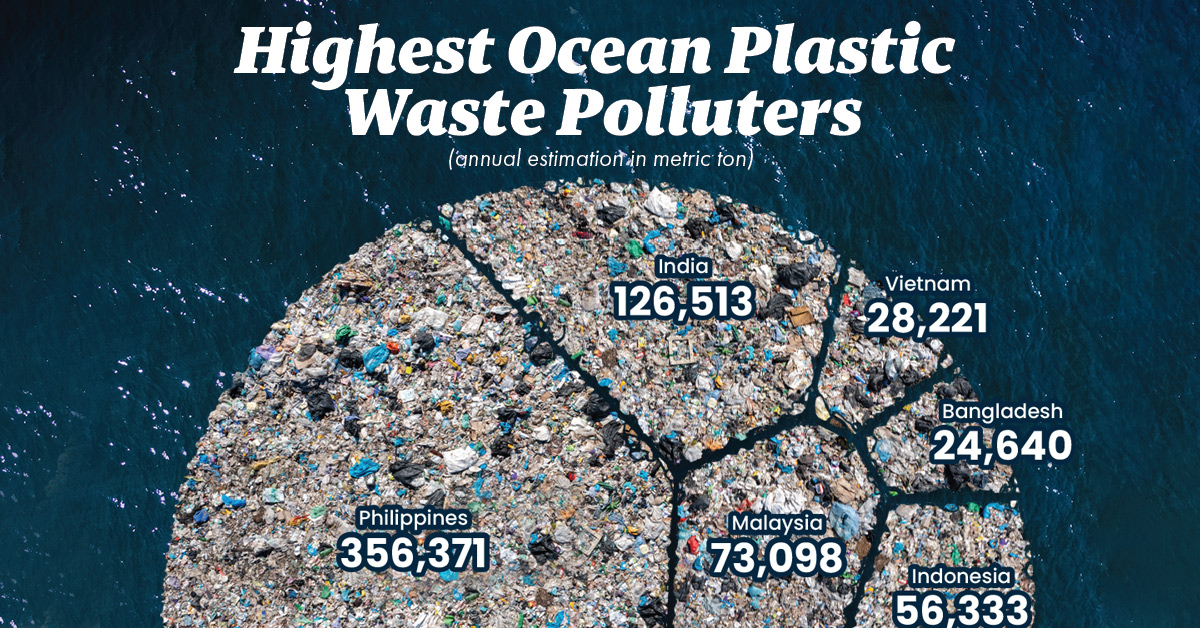
The size of countries is the outcome of politics, economics, history, and geography. Put simply, borders can change over time. In 1946, there were 76 independent countries in the world, and today there are 195. There are forces that push together or pull apart landscapes over time. While physical geography plays a role in the identity of nations, Sheikh Zayed bin Sultan Al Nahyan, the former ruler of UAE, a tiny Gulf nation, put it best: on In fact, many pieces of ocean plastic waste have come together to create a vortex of plastic waste thrice the size of France in the Pacific Ocean between California and Hawaii. Where does all of this plastic come from? In this graphic, Louis Lugas Wicaksono used data from a research paper by Lourens J.J. Meijer and team to highlight the top 10 countries emitting plastic pollutants in the waters surrounding them.
Plastic’s Ocean Voyage
First, let’s talk about how this plastic waste reaches the oceans in the first place. Most of the plastic waste found in the deep blue waters comes from the litter in parks, beaches, or along the storm drains lining our streets. These bits of plastic waste are carried into our drains, streams, and rivers by wind and rainwater runoff. The rivers then turn into plastic superhighways, transporting the plastic to the oceans. A large additional chunk of ocean plastic comes from damaged fishing nets or ghost nets that are directly discarded into the high seas.
Countries Feeding the Plastic Problem
Some might think that the countries producing or consuming the most plastic are the ones that pollute the oceans the most. But that’s not true. According to the study, countries with a smaller geographical area, longer coastlines, high rainfall, and poor waste management systems are more likely to wash plastics into the sea. For example, China generates 10 times the plastic waste that Malaysia does. However, 9% of Malaysia’s total plastic waste is estimated to reach the ocean, in comparison to China’s 0.6%. The Philippines—an archipelago of over 7,000 islands, with a 36,289 kilometer coastline and 4,820 plastic emitting rivers—is estimated to emit 35% of the ocean’s plastic. In addition to the Philippines, over 75% of the accumulated plastic in the ocean is reported to come from the mismanaged waste in Asian countries including India, Malaysia, China, Indonesia, Myanmar, Vietnam, Bangladesh, and Thailand.
The Path to a Plastic-free Ocean
The first, and most obvious, way to reduce plastic accumulation is to reduce the use of plastic. Lesser production equals lesser waste. The second step is managing the plastic waste generated, and this is where the challenge lies. Many high-income countries generate high amounts of plastic waste, but are either better at processing it or exporting it to other countries. Meanwhile, many of the middle-income and low-income countries that both demand plastics and receive bulk exports have yet to develop the infrastructure needed to process it.