This week’s chart outlines the interest rates attached to loans dating back to the 1350s. Take a look at the diminishing history of the cost of debt—money has never been cheaper for governments to borrow than it is today.
The Birth of an Investing Class
Trade brought many good ideas to Europe, while helping spur the Renaissance and the development of the money economy. Key European ports and trading nations, such as the Republic of Genoa or the Netherlands during the Renaissance period, help provide a good indication of the cost of borrowing in the early history of interest rates.
The Republic of Genoa: 4-5 year Lending Rate
Genoa became a junior associate of the Spanish Empire, with Genovese bankers financing many of the Spanish crown’s foreign endeavors. Genovese bankers provided the Spanish royal family with credit and regular income. The Spanish crown also converted unreliable shipments of New World silver into capital for further ventures through bankers in Genoa.
Dutch Perpetual Bonds
A perpetual bond is a bond with no maturity date. Investors can treat this type of bond as an equity, not as debt. Issuers pay a coupon on perpetual bonds forever, and do not have to redeem the principal—much like the dividend from a blue-chip company.
By 1640, there was so much confidence in Holland’s public debt, that it made the refinancing of outstanding debt with a much lower interest rate of 5% possible.
Dutch provincial and municipal borrowers issued three types of debt:
Unlike other countries where private bankers issued public debt, Holland dealt directly with prospective bondholders. They issued many bonds of small coupons that attracted small savers, like craftsmen and often women.
Rule Britannia: British Consols
In 1752, the British government converted all its outstanding debt into one bond, the Consolidated 3.5% Annuities, in order to reduce the interest rate it paid. Five years later, the annual interest rate on the stock dropped to 3%, adjusting the stock as Consolidated 3% Annuities. The coupon rate remained at 3% until 1888, when the finance minister converted the Consolidated 3% Annuities, along with Reduced 3% Annuities (1752) and New 3% Annuities (1855), into a new bond─the 2.75% Consolidated Stock. The interest rate was further reduced to 2.5% in 1903. Interest rates briefly went back up in 1927 when Winston Churchill issued a new government stock, the 4% Consols, as a partial refinancing of WWI war bonds.
American Ascendancy: The U.S. Treasury Notes
The United States Congress passed an act in 1870 authorizing three separate consol issues with redemption privileges after 10, 15, and 30 years. This was the beginning of what became known as Treasury Bills, the modern benchmark for interest rates.
The Great Inflation of the 1970s
In the 1970s, the global stock market was a mess. Over an 18-month period, the market lost 40% of its value. For close to a decade, few people wanted to invest in public markets. Economic growth was weak, resulting in double-digit unemployment rates. The low interest policies of the Federal Reserve in the early ‘70s encouraged full employment, but also caused high inflation. Under new leadership, the central bank would later reverse its policies, raising interest rates to 20% in an effort to reset capitalism and encourage investment.
Looking Forward: Cheap Money
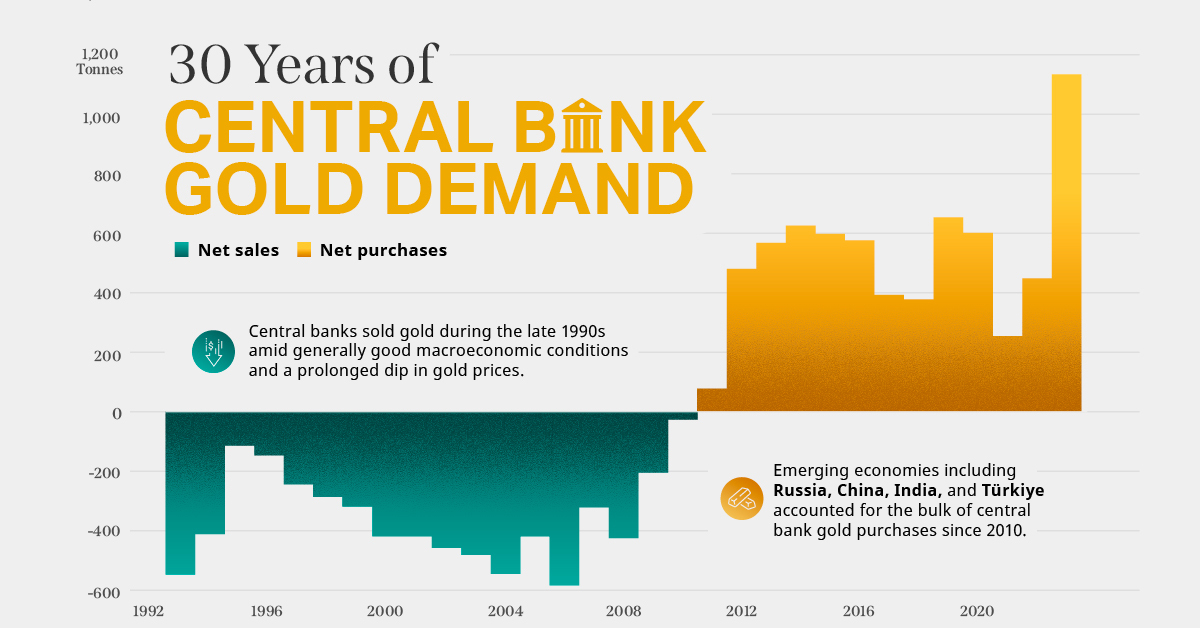
Since then, interest rates set by government debt have been rapidly declining, while the global economy has rapidly expanded. Further, financial crises have driven interest rates to just above zero in order to spur spending and investment. It is clear that the arc of lending bends towards ever-decreasing interest rates, but how low can they go? on Did you know that nearly one-fifth of all the gold ever mined is held by central banks? Besides investors and jewelry consumers, central banks are a major source of gold demand. In fact, in 2022, central banks snapped up gold at the fastest pace since 1967. However, the record gold purchases of 2022 are in stark contrast to the 1990s and early 2000s, when central banks were net sellers of gold. The above infographic uses data from the World Gold Council to show 30 years of central bank gold demand, highlighting how official attitudes toward gold have changed in the last 30 years.
Why Do Central Banks Buy Gold?
Gold plays an important role in the financial reserves of numerous nations. Here are three of the reasons why central banks hold gold:
Balancing foreign exchange reserves Central banks have long held gold as part of their reserves to manage risk from currency holdings and to promote stability during economic turmoil. Hedging against fiat currencies Gold offers a hedge against the eroding purchasing power of currencies (mainly the U.S. dollar) due to inflation. Diversifying portfolios Gold has an inverse correlation with the U.S. dollar. When the dollar falls in value, gold prices tend to rise, protecting central banks from volatility. The Switch from Selling to Buying In the 1990s and early 2000s, central banks were net sellers of gold. There were several reasons behind the selling, including good macroeconomic conditions and a downward trend in gold prices. Due to strong economic growth, gold’s safe-haven properties were less valuable, and low returns made it unattractive as an investment. Central bank attitudes toward gold started changing following the 1997 Asian financial crisis and then later, the 2007–08 financial crisis. Since 2010, central banks have been net buyers of gold on an annual basis. Here’s a look at the 10 largest official buyers of gold from the end of 1999 to end of 2021: Rank CountryAmount of Gold Bought (tonnes)% of All Buying #1🇷🇺 Russia 1,88828% #2🇨🇳 China 1,55223% #3🇹🇷 Türkiye 5418% #4🇮🇳 India 3956% #5🇰🇿 Kazakhstan 3455% #6🇺🇿 Uzbekistan 3115% #7🇸🇦 Saudi Arabia 1803% #8🇹🇭 Thailand 1682% #9🇵🇱 Poland1282% #10🇲🇽 Mexico 1152% Total5,62384% Source: IMF The top 10 official buyers of gold between end-1999 and end-2021 represent 84% of all the gold bought by central banks during this period. Russia and China—arguably the United States’ top geopolitical rivals—have been the largest gold buyers over the last two decades. Russia, in particular, accelerated its gold purchases after being hit by Western sanctions following its annexation of Crimea in 2014. Interestingly, the majority of nations on the above list are emerging economies. These countries have likely been stockpiling gold to hedge against financial and geopolitical risks affecting currencies, primarily the U.S. dollar. Meanwhile, European nations including Switzerland, France, Netherlands, and the UK were the largest sellers of gold between 1999 and 2021, under the Central Bank Gold Agreement (CBGA) framework. Which Central Banks Bought Gold in 2022? In 2022, central banks bought a record 1,136 tonnes of gold, worth around $70 billion. Country2022 Gold Purchases (tonnes)% of Total 🇹🇷 Türkiye14813% 🇨🇳 China 625% 🇪🇬 Egypt 474% 🇶🇦 Qatar333% 🇮🇶 Iraq 343% 🇮🇳 India 333% 🇦🇪 UAE 252% 🇰🇬 Kyrgyzstan 61% 🇹🇯 Tajikistan 40.4% 🇪🇨 Ecuador 30.3% 🌍 Unreported 74165% Total1,136100% Türkiye, experiencing 86% year-over-year inflation as of October 2022, was the largest buyer, adding 148 tonnes to its reserves. China continued its gold-buying spree with 62 tonnes added in the months of November and December, amid rising geopolitical tensions with the United States. Overall, emerging markets continued the trend that started in the 2000s, accounting for the bulk of gold purchases. Meanwhile, a significant two-thirds, or 741 tonnes of official gold purchases were unreported in 2022. According to analysts, unreported gold purchases are likely to have come from countries like China and Russia, who are looking to de-dollarize global trade to circumvent Western sanctions.
There were several reasons behind the selling, including good macroeconomic conditions and a downward trend in gold prices. Due to strong economic growth, gold’s safe-haven properties were less valuable, and low returns made it unattractive as an investment.
Central bank attitudes toward gold started changing following the 1997 Asian financial crisis and then later, the 2007–08 financial crisis. Since 2010, central banks have been net buyers of gold on an annual basis.
Here’s a look at the 10 largest official buyers of gold from the end of 1999 to end of 2021:
Source: IMF
The top 10 official buyers of gold between end-1999 and end-2021 represent 84% of all the gold bought by central banks during this period.
Russia and China—arguably the United States’ top geopolitical rivals—have been the largest gold buyers over the last two decades. Russia, in particular, accelerated its gold purchases after being hit by Western sanctions following its annexation of Crimea in 2014.
Interestingly, the majority of nations on the above list are emerging economies. These countries have likely been stockpiling gold to hedge against financial and geopolitical risks affecting currencies, primarily the U.S. dollar.
Meanwhile, European nations including Switzerland, France, Netherlands, and the UK were the largest sellers of gold between 1999 and 2021, under the Central Bank Gold Agreement (CBGA) framework.
Which Central Banks Bought Gold in 2022?
In 2022, central banks bought a record 1,136 tonnes of gold, worth around $70 billion. Türkiye, experiencing 86% year-over-year inflation as of October 2022, was the largest buyer, adding 148 tonnes to its reserves. China continued its gold-buying spree with 62 tonnes added in the months of November and December, amid rising geopolitical tensions with the United States. Overall, emerging markets continued the trend that started in the 2000s, accounting for the bulk of gold purchases. Meanwhile, a significant two-thirds, or 741 tonnes of official gold purchases were unreported in 2022. According to analysts, unreported gold purchases are likely to have come from countries like China and Russia, who are looking to de-dollarize global trade to circumvent Western sanctions.