From the bronze age to the iron age, metals have defined eras of human history. If our current era had to be defined similarly, it would undoubtedly be known as the steel age. Steel is the foundation of our buildings, vehicles, and industries, with its rates of production and consumption often seen as markers for a nation’s development. Today, it is the world’s most commonly used metal and most recycled material, with 1,864 million metric tons of crude steel produced in 2020. This infographic uses data from the World Steel Association to visualize 50 years of crude steel production, showcasing our world’s unrelenting creation of this essential material.
The State of Steel Production
Global steel production has more than tripled over the past 50 years, despite nations like the U.S. and Russia scaling down their domestic production and relying more on imports. Meanwhile, China and India have consistently grown their production to become the top two steel producing nations. Below are the world’s current top crude steel producing nations by 2020 production. Source: World Steel Association. *Estimates. Despite its current dominance, China could be preparing to scale back domestic steel production to curb overproduction risks and ensure it can reach carbon neutrality by 2060. As iron ore and steel prices have skyrocketed in the last year, U.S. demand could soon lessen depending on the Biden administration’s actions. A potential infrastructure bill would bring investment into America’s steel mills to build supply for the future, and any walkbalk on the Trump administration’s 2018 tariffs on imported steel could further soften supply constraints.
Steel’s Secret: Infinite Recyclability
Made up primarily of iron ore, steel is an alloy which also contains less than 2% carbon and 1% manganese and other trace elements. While the defining difference might seem small, steel can be 1,000x stronger than iron. However, steel’s true strength lies in its infinite recyclability with no loss of quality. No matter the grade or application, steel can always be recycled, with new steel products containing 30% recycled steel on average. The alloy’s magnetic properties make it easy to recover from waste streams, and nearly 100% of the steel industry’s co-products can be used in other manufacturing or electricity generation. It’s fitting then that steel makes up essential parts of various sustainable energy technologies:
The average wind turbine is made of 80% steel on average (140 metric tons). Steel is used in the base, pumps, tanks, and heat exchangers of solar power installations. Electrical steel is at the heart of the generators and motors of electric and hybrid vehicles.
The Steel Industry’s Future Sustainability
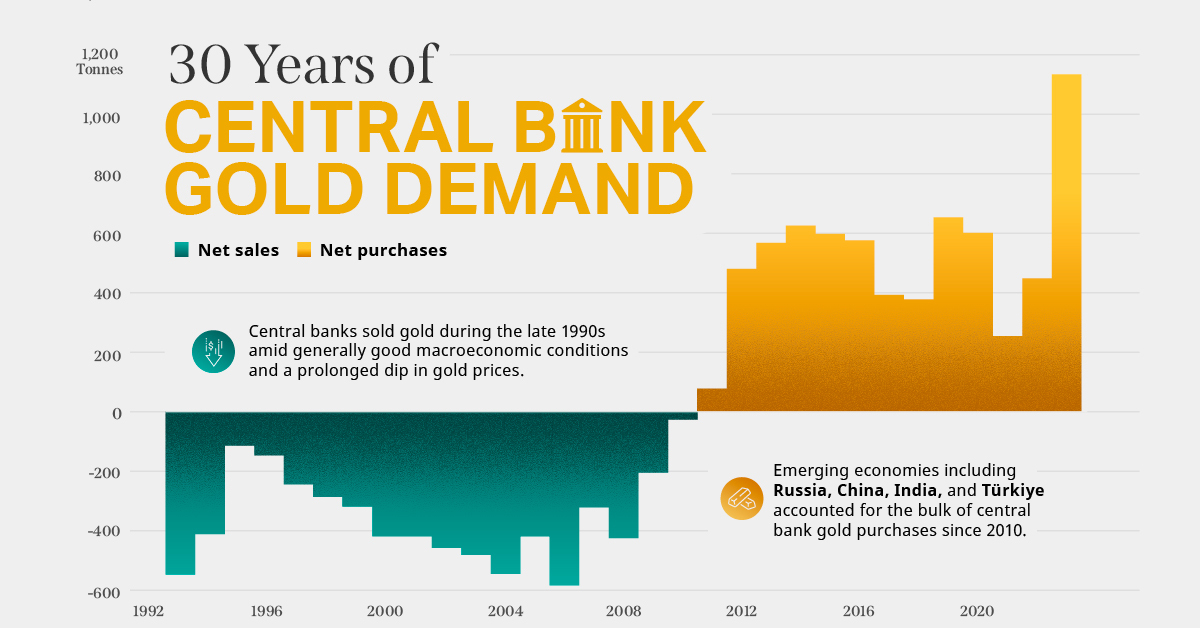
Considering the crucial role steel plays in just about every industry, it’s no wonder that prices are surging to record highs. However, steel producers are thinking about long-term sustainability, and are working to make fossil-fuel-free steel a reality by completely removing coal from the metallurgical process. While the industry has already cut down the average energy intensity per metric ton produced from 50 gigajoules to 20 gigajoules since the 1960s, steel-producing giants like ArcelorMittal are going further and laying out their plans for carbon-neutral steel production by 2050. Steel consumption and demand is only set to continue rising as the world’s economy gradually reopens, especially as Rio Tinto’s new development of atomized steel powder could bring about the next evolution in 3D printing. As the industry continues to innovate in both sustainability and usability, steel will continue to be a vital material across industries that we can infinitely recycle and rely on. on Did you know that nearly one-fifth of all the gold ever mined is held by central banks? Besides investors and jewelry consumers, central banks are a major source of gold demand. In fact, in 2022, central banks snapped up gold at the fastest pace since 1967. However, the record gold purchases of 2022 are in stark contrast to the 1990s and early 2000s, when central banks were net sellers of gold. The above infographic uses data from the World Gold Council to show 30 years of central bank gold demand, highlighting how official attitudes toward gold have changed in the last 30 years.
Why Do Central Banks Buy Gold?
Gold plays an important role in the financial reserves of numerous nations. Here are three of the reasons why central banks hold gold:
Balancing foreign exchange reserves Central banks have long held gold as part of their reserves to manage risk from currency holdings and to promote stability during economic turmoil. Hedging against fiat currencies Gold offers a hedge against the eroding purchasing power of currencies (mainly the U.S. dollar) due to inflation. Diversifying portfolios Gold has an inverse correlation with the U.S. dollar. When the dollar falls in value, gold prices tend to rise, protecting central banks from volatility. The Switch from Selling to Buying In the 1990s and early 2000s, central banks were net sellers of gold. There were several reasons behind the selling, including good macroeconomic conditions and a downward trend in gold prices. Due to strong economic growth, gold’s safe-haven properties were less valuable, and low returns made it unattractive as an investment. Central bank attitudes toward gold started changing following the 1997 Asian financial crisis and then later, the 2007–08 financial crisis. Since 2010, central banks have been net buyers of gold on an annual basis. Here’s a look at the 10 largest official buyers of gold from the end of 1999 to end of 2021: Rank CountryAmount of Gold Bought (tonnes)% of All Buying #1🇷🇺 Russia 1,88828% #2🇨🇳 China 1,55223% #3🇹🇷 Türkiye 5418% #4🇮🇳 India 3956% #5🇰🇿 Kazakhstan 3455% #6🇺🇿 Uzbekistan 3115% #7🇸🇦 Saudi Arabia 1803% #8🇹🇭 Thailand 1682% #9🇵🇱 Poland1282% #10🇲🇽 Mexico 1152% Total5,62384% Source: IMF The top 10 official buyers of gold between end-1999 and end-2021 represent 84% of all the gold bought by central banks during this period. Russia and China—arguably the United States’ top geopolitical rivals—have been the largest gold buyers over the last two decades. Russia, in particular, accelerated its gold purchases after being hit by Western sanctions following its annexation of Crimea in 2014. Interestingly, the majority of nations on the above list are emerging economies. These countries have likely been stockpiling gold to hedge against financial and geopolitical risks affecting currencies, primarily the U.S. dollar. Meanwhile, European nations including Switzerland, France, Netherlands, and the UK were the largest sellers of gold between 1999 and 2021, under the Central Bank Gold Agreement (CBGA) framework. Which Central Banks Bought Gold in 2022? In 2022, central banks bought a record 1,136 tonnes of gold, worth around $70 billion. Country2022 Gold Purchases (tonnes)% of Total 🇹🇷 Türkiye14813% 🇨🇳 China 625% 🇪🇬 Egypt 474% 🇶🇦 Qatar333% 🇮🇶 Iraq 343% 🇮🇳 India 333% 🇦🇪 UAE 252% 🇰🇬 Kyrgyzstan 61% 🇹🇯 Tajikistan 40.4% 🇪🇨 Ecuador 30.3% 🌍 Unreported 74165% Total1,136100% Türkiye, experiencing 86% year-over-year inflation as of October 2022, was the largest buyer, adding 148 tonnes to its reserves. China continued its gold-buying spree with 62 tonnes added in the months of November and December, amid rising geopolitical tensions with the United States. Overall, emerging markets continued the trend that started in the 2000s, accounting for the bulk of gold purchases. Meanwhile, a significant two-thirds, or 741 tonnes of official gold purchases were unreported in 2022. According to analysts, unreported gold purchases are likely to have come from countries like China and Russia, who are looking to de-dollarize global trade to circumvent Western sanctions.
There were several reasons behind the selling, including good macroeconomic conditions and a downward trend in gold prices. Due to strong economic growth, gold’s safe-haven properties were less valuable, and low returns made it unattractive as an investment.
Central bank attitudes toward gold started changing following the 1997 Asian financial crisis and then later, the 2007–08 financial crisis. Since 2010, central banks have been net buyers of gold on an annual basis.
Here’s a look at the 10 largest official buyers of gold from the end of 1999 to end of 2021:
Source: IMF
The top 10 official buyers of gold between end-1999 and end-2021 represent 84% of all the gold bought by central banks during this period.
Russia and China—arguably the United States’ top geopolitical rivals—have been the largest gold buyers over the last two decades. Russia, in particular, accelerated its gold purchases after being hit by Western sanctions following its annexation of Crimea in 2014.
Interestingly, the majority of nations on the above list are emerging economies. These countries have likely been stockpiling gold to hedge against financial and geopolitical risks affecting currencies, primarily the U.S. dollar.
Meanwhile, European nations including Switzerland, France, Netherlands, and the UK were the largest sellers of gold between 1999 and 2021, under the Central Bank Gold Agreement (CBGA) framework.
Which Central Banks Bought Gold in 2022?
In 2022, central banks bought a record 1,136 tonnes of gold, worth around $70 billion. Türkiye, experiencing 86% year-over-year inflation as of October 2022, was the largest buyer, adding 148 tonnes to its reserves. China continued its gold-buying spree with 62 tonnes added in the months of November and December, amid rising geopolitical tensions with the United States. Overall, emerging markets continued the trend that started in the 2000s, accounting for the bulk of gold purchases. Meanwhile, a significant two-thirds, or 741 tonnes of official gold purchases were unreported in 2022. According to analysts, unreported gold purchases are likely to have come from countries like China and Russia, who are looking to de-dollarize global trade to circumvent Western sanctions.