In the U.S., the latter view appears to have taken hold. Since 2008, America’s national debt has surged nearly 200%, reaching $27 trillion as of October 2020. To gain a better understanding of this ever-growing debt, this infographic takes a closer look at various U.S. budgetary datasets including the 2019 fiscal balance.
America’s Debt vs. GDP
Government debts are often represented by incredibly large numbers, making them hard to comprehend. By comparing America’s debt to its annual GDP, we can get a better grasp on the relative size of the country’s financial obligations. Source: Federal Reserve, U.S. Treasury In this context, U.S. debt was relatively moderate between 1994 to 2007, averaging 60% of GDP over the timeframe. This took a drastic turn during the Global Financial Crisis, with debt climbing to 95% of GDP by 2012. Since then, America’s debt has only increased in relative size. In April 2020, with the COVID-19 pandemic in full force, it reached a record 122% of GDP. This may sound troubling at first, but there are a few caveats. For starters, there are many other advanced economies that have also surpassed the 100% debt-to-GDP milestone. The most noteworthy is Japan, where the debt-to-GDP ratio has climbed beyond 200%. Furthermore, this is not the first time America has found itself in this situation—by the end of World War II, debt-to-GDP peaked at 106% before declining to historic lows in the 1970s.
What’s Preventing the Debt From Shrinking?
Although the U.S. continuously pays off portions of its debt, the total amount it owes has increased each year since 2001. That’s because the federal government runs consistent budget deficits, meaning it spends more than it earns. During economic crises, these deficits can become incredibly large. Source: Federal Reserve In the aftermath of the Global Financial Crisis, the U.S. recorded an annual deficit of $1.4 trillion in FY2009. This was largely due to the $787 billion American Recovery and Reinvestment Act of 2009, which provided tax rebates and other economic relief. In the economic battle against COVID-19’s impacts, the boundaries have been pushed even further. The annual deficit for FY2020 weighs in at a staggering $3.1 trillion, the largest ever. Contributing to this historic deficit was the $2 trillion CARES Act, which provided wide-ranging support to the entire U.S. economy.
Breaking Down the 2019 Fiscal Balance
Even in the years between these two economic crises, government spending still outpaced revenues. To find out more, we’ve broken down the 2019 fiscal balance into its various components.
Federal Spending
Total spending in FY2019 was roughly $4.4 trillion, and can be broken out into three components. The first component is Mandatory Spending, which accounted for 62% of the total. Mandatory spending is required by law, and includes funding for important programs such as social security. Figures may not add to 100 due to rounding. Source: Peter G. Peterson Foundation The largest category here was Health, with $1.1 trillion in funding for programs such as Medicare and Medicaid. Social security, which provides payments to retirees, was the second largest at $1.0 trillion. The second component is Discretionary Spending, which accounted for 30% of the total. Discretionary spending is determined on an annual basis by Congress and the President. Figures may not add to 100 due to rounding. Source: Peter G. Peterson Foundation At $677 billion, the Defense category represents over half of total discretionary spending. These funds are spread across the five branches of the U.S. military: the Army, Marine Corps, Navy, Air Force, and Space Force. The third component of spending is the net interest costs on existing government debt. For FY2019, this was approximately $327 billion.
Federal Revenues
Revenues in FY2019 fell short of total spending, coming in at approximately $3.5 trillion. These inflows can be traced back to six categories. Figures may not add to 100 due to rounding. Source: Peter G. Peterson Foundation Revenues overwhelmingly relied on individual income and payroll taxes, which together, accounted for 86% of the total. Corporate income taxes, on the other hand, accounted for just 7%.
Is America’s Debt a Cause for Concern?
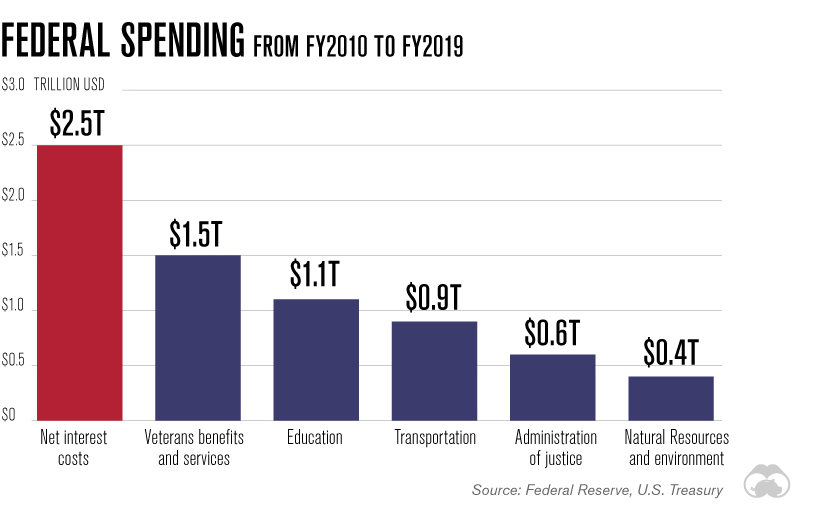
The general consensus following the events of 2008 is that large fiscal stimulus (supported by government borrowing) was effective in speeding up the consequent recovery. Now facing a pandemic, it’s likely that many Americans would support the idea of running large deficits to boost the economy. Surveys released in July 2020, for example, found that 82% of Americans wanted federal relief measures to be extended. Looking beyond COVID-19, however, does reveal some warning signs. One frequent criticism of the ever-growing national debt is its associated interest costs, which could cannibalize investment in other areas. In fact, the effects of this dilemma are already becoming apparent. Over the past decade, the U.S. has spent more on interest than it has on programs such as veterans benefits and education.
With low interest rates expected for the foreseeable future, the federal government is likely to continue running its large annual deficits—at least until the effects of COVID-19 have fully subsided. Perhaps after this crisis is over, it will be time to assess the long-term sustainability of America’s rising national debt. on In this infographic, we’ve visualized data from the Fed’s most recent consumer debt update.
Aggressive Borrowing
The first chart in this graphic shows the growth in outstanding car loans between Q2 2020 (start of the pandemic) to Q4 2022 (latest available). We can see that Americans under the age of 40 have grown their vehicle-related debt the most. It’s natural for Gen Z (ages 11-26) to have higher growth figures because many of them are buying their first car, but 31% is quite high relatively speaking. Part of this can be attributed to today’s inflationary environment, which has pushed used car prices to new highs. Supply chain issues have also resulted in over 30% of new cars being sold above MSRP. Because of these rising prices, the Fed reports that the average auto loan is now $24,000, up 41% from 2019’s value of $17,000.
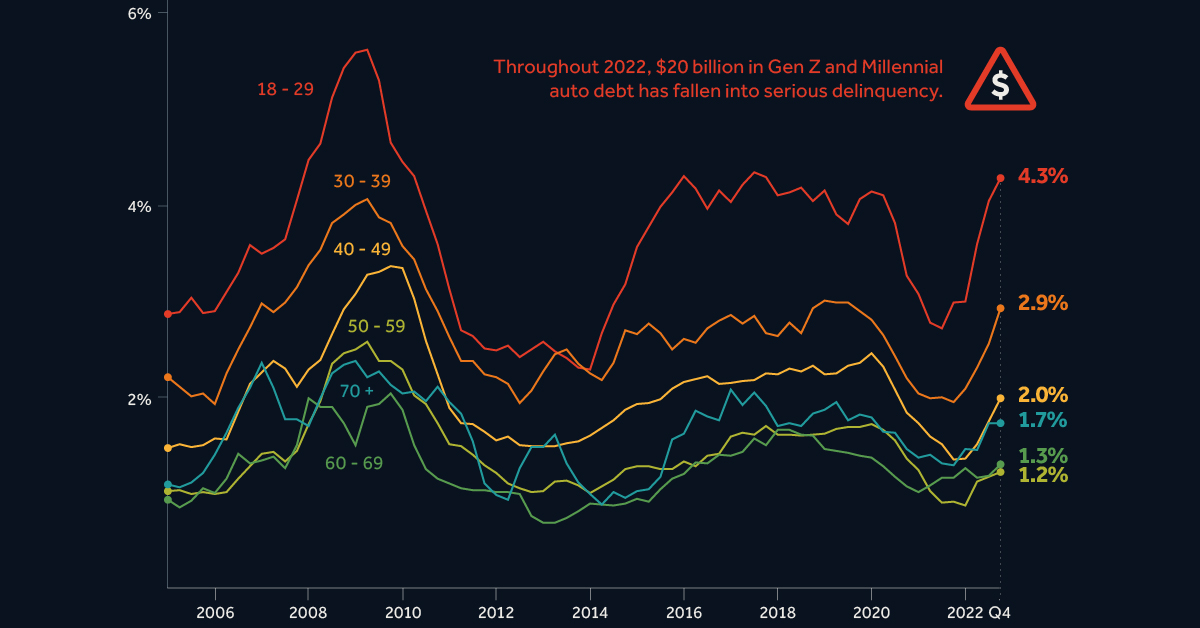
Spiking Delinquencies
Interest rates on auto loans are typically fixed, meaning many young Americans were able to take advantage of the low rates seen during the pandemic. Despite this, one in five Gen Zs say that their car payments account for over 20% of their after-tax income. Shown in the second chart of this infographic, the amount of auto debt transitioning into serious delinquency is much higher for Gen Z and Millennials. Throughout 2022, these generations saw $20 billion in auto debt fall 90+ days behind. The outlook for these struggling borrowers is bleak. First there’s inflation, which has pushed up the prices of most consumer goods. This eats into their ability to make car payments. Second is rising interest rates, which make credit card debt—another pain point for young borrowers—even more costly. Finally, there’s student loans, which are expected to resume in summer 2023. Payments on student debt have been suspended since the beginning of the COVID-19 pandemic.