NAFTA’s Mixed Track Record
Cheat sheet sums up the results of North American trade since 1994
The Chart of the Week is a weekly Visual Capitalist feature on Fridays. On January 1, 1994, the North American Free Trade Agreement (NAFTA) officially came into effect, virtually eliminating all tariffs and trade restrictions between the United States, Canada, and Mexico. Bill Clinton, who lobbied extensively to get the deal done, said it would encourage other nations to work towards a broader world-trade pact. “NAFTA means jobs. American jobs, and good-paying American jobs,” said Clinton, as he signed the document, “If I didn’t believe that, I wouldn’t support this agreement.” Ross Perot had a contrary perspective. Lobbying heavily against the agreement, he noted that if it was ratified, Americans would hear a giant “sucking sound” as jobs went south of the border to Mexico.
It’s a Complicated World
Fast forward 20 years, and NAFTA is a hot-button issue again. Donald Trump has said he is working on “renegotiating” the agreement, and many Americans are sympathetic to this course of action. However, coming to a decisive viewpoint on NAFTA’s success or failure can be difficult to achieve. Over two decades, the economic and political landscape has changed. China has risen and created a surplus of cheap labor, technology has changed massively, and central banks have kept the spigots on with QE and ultra-low interest rates. Deciphering what results have been the direct cause of NAFTA – and what is simply the result of a fast-changing world – is not quite straightforward. In today’s chart, we break down a variety of metrics on the U.S., Canada, and Mexico to give a “before” and “after” story. The result is a mixed bag, but it will at least paint a picture of how the nations have fared comparatively since the agreement came into effect in 1994.
NAFTA: A Mixed Track Record
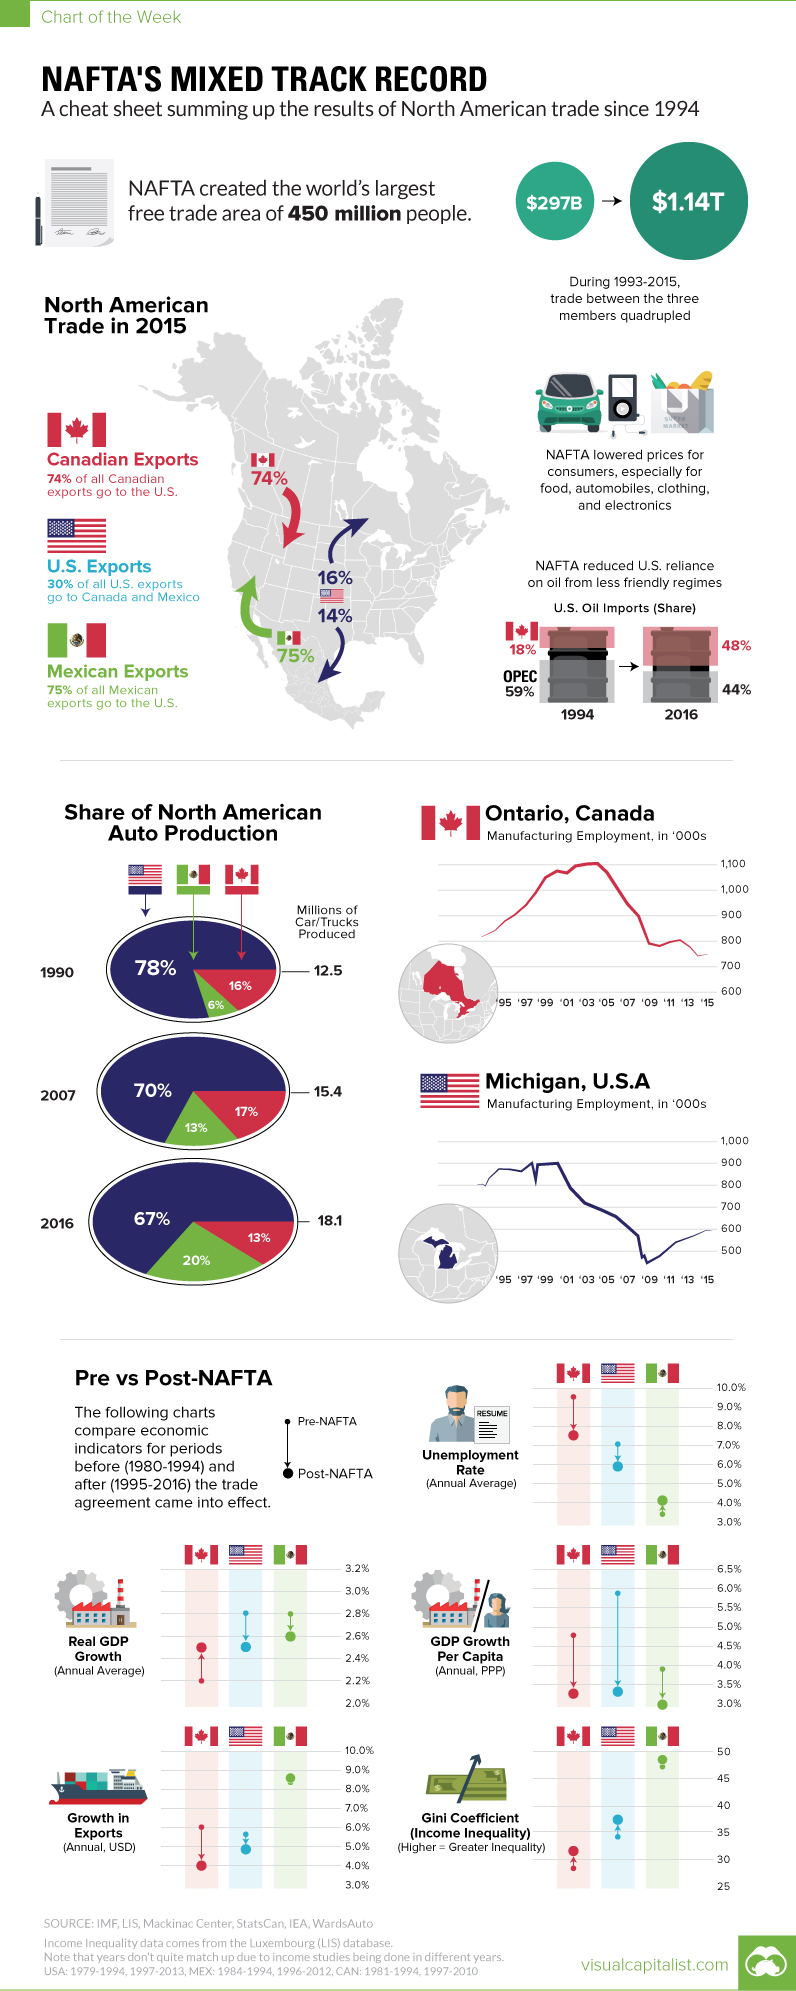
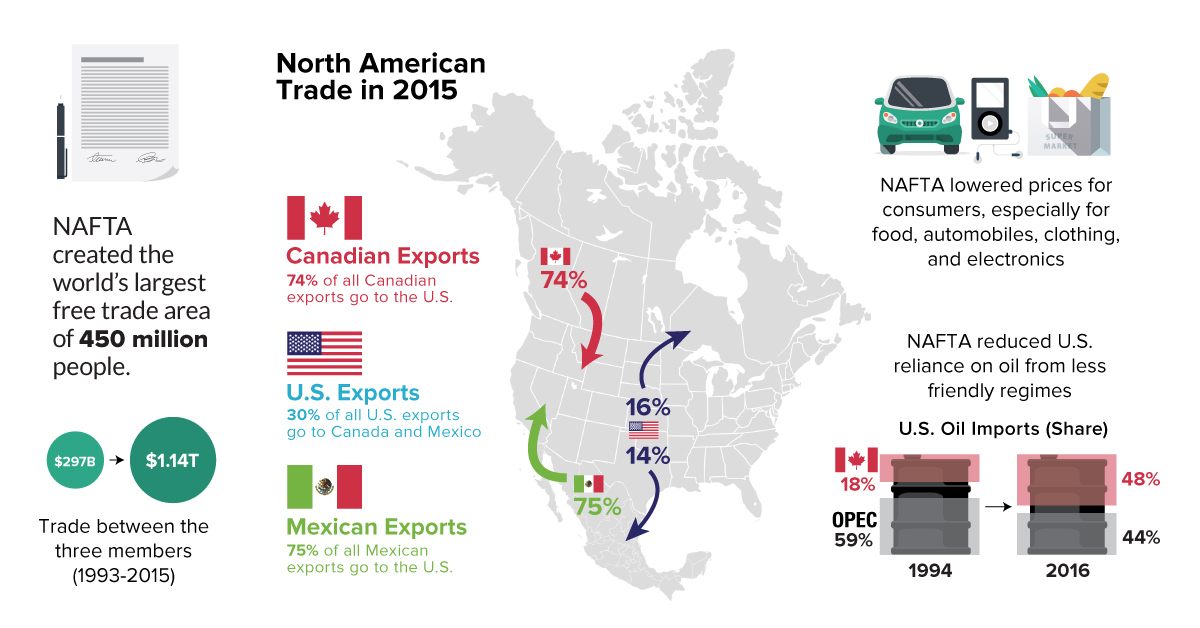
On the plus side, NAFTA created the world’s largest free trade area of 450 million people, where trade between the three members quadrupled from $297 billion to $1.14 trillion during the period of 1993-2015. Further, the agreement likely had the effect of lowering prices for consumers, especially for food, automobiles, clothing, and electronics. It also reduced U.S. reliance on oil from OPEC. In 1994, the United States got 59% of its oil imports from OPEC, but that number is reduced to 44% today as trade with Canada has ramped up. Canada is now the #1 source of foreign oil in the United States. NAFTA has also unequivocally led to the movement of auto jobs. While the amount of autos manufactured in North America has increased from 12.5 million (1990) to 18.1 million (2016), the share of that production has shifted. North American Auto Production by Share Mexico now produces 20% of all vehicles in North America – and U.S./Canadian shares have shifted down accordingly over the years. The ultimate result is the destruction of hundreds of thousands of jobs in both Michigan and Ontario, Canada. As a final note, we also looked at comparing macroeconomic indicators from 1980-1993 (“Pre-NAFTA”) with those from 1994-2016 (“Post-NAFTA”). For the U.S. in particular, here’s what has changed: This is not intended to be a comprehensive analysis, but it gives a snapshot of what has changed since NAFTA was ratified. on The good news is that the Federal Reserve, U.S. Treasury, and Federal Deposit Insurance Corporation are taking action to restore confidence and take the appropriate measures to help provide stability in the market. With this in mind, the above infographic from New York Life Investments looks at the factors that impact bonds, how different types of bonds have historically performed across market environments, and the current bond market volatility in a broader context.
Bond Market Returns
Bonds had a historic year in 2022, posting one of the worst returns ever recorded. As interest rates rose at the fastest pace in 40 years, it pushed bond prices lower due to their inverse relationship. In a rare year, bonds dropped 13%.
Source: FactSet, 01/02/2023.
Bond prices are only one part of a bond’s total return—the other looks at the income a bond provides. As interest rates have increased in the last year, it has driven higher bond yields in 2023.
Source: YCharts, 3/20/2023.
With this recent performance in mind, let’s look at some other key factors that impact the bond market.
Factors Impacting Bond Markets
Interest rates play a central role in bond market dynamics. This is because they affect a bond’s price. When rates are rising, existing bonds with lower rates are less valuable and prices decline. When rates are dropping, existing bonds with higher rates are more valuable and their prices rise. In March, the Federal Reserve raised rates 25 basis points to fall within the 4.75%-5.00% range, a level not seen since September 2007. Here are projections for where the federal funds rate is headed in 2023:
Federal Reserve Projection*: 5.1% Economist Projections**: 5.3%
*Based on median estimates in the March summary of quarterly economic projections.**Projections based on March 10-15 Bloomberg economist survey. Together, interest rates and the macroenvironment can have a positive or negative effect on bonds.
Positive
Here are three variables that may affect bond prices in a positive direction:
Lower Inflation: Reduces likelihood of interest rate hikes. Lower Interest Rates: When rates are falling, bond prices are typically higher. Recession: Can prompt a cut in interest rates, boosting bond prices.
Negative
On the other hand, here are variables that may negatively impact bond prices:
Higher Inflation: Can increase the likelihood of the Federal Reserve to raise interest rates. Rising Interest Rates: Interest rate hikes lead bond prices to fall. Weaker Fundamentals: When a bond’s credit risk gets worse, its price can drop. Credit risk indicates the chance of a default, the risk of a bond issuer not making interest payments within a given time period.
Bonds have been impacted by these negative factors since inflation started rising in March 2021.
Fixed Income Opportunities
Below, we show the types of bonds that have had the best performance during rising rates and recessions.
Source: Derek Horstmeyer, George Mason University 12/3/2022. As we can see, U.S. ultrashort bonds performed the best during rising rates. Mortgage bonds outperformed during recessions, averaging 11.4% returns, but with higher volatility. U.S. long-term bonds had 7.7% average returns, the best across all market conditions. In fact, they were also a close second during recessions. When rates are rising, ultrashort bonds allow investors to capture higher rates when they mature, often with lower historical volatility.
A Closer Look at Bond Market Volatility
While bond market volatility has jumped this year, current dislocations may provide investment opportunities. Bond dislocations allow investors to buy at lower prices, factoring in that the fundamental quality of the bond remains strong. With this in mind, here are two areas of the bond market that may provide opportunities for investors:
Investment-Grade Corporate Bonds: Higher credit quality makes them potentially less vulnerable to increasing interest rates. Intermediate Bonds (2-10 Years): Allow investors to lock in higher rates.
Both types of bonds focus on quality and capturing higher yields when faced with challenging market conditions.
Finding the Upside
Much of the volatility seen in the banking sector was due to banks buying bonds during the pandemic—or even earlier—at a time when interest rates were historically low. Since then, rates have climbed considerably. Should rates moderate or stop increasing, this may present better market conditions for bonds. In this way, today’s steep discount in bond markets may present an attractive opportunity for price appreciation. At the same time, investors can potentially lock in strong yields as inflation may subside in the coming years ahead. Learn more about bond investing strategies with New York Life Investments.