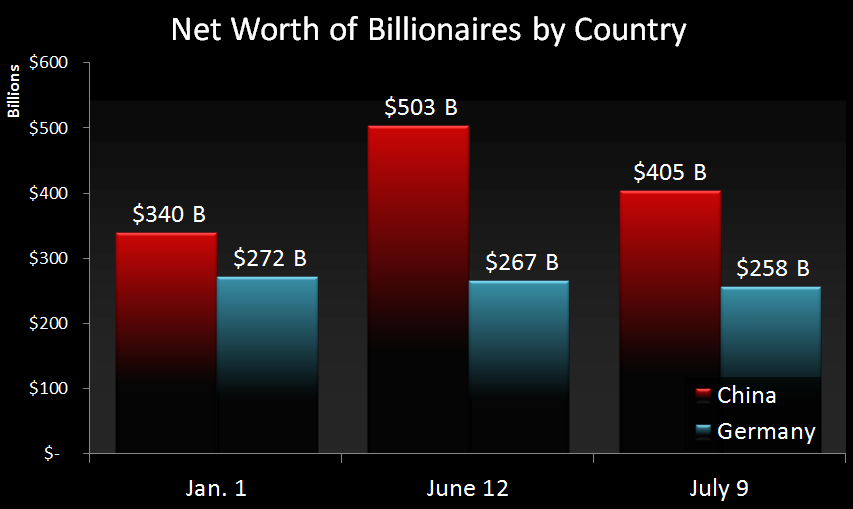
From there, participants in the market have had their will tested, as the market suddenly corrected by dropping 30% in the course of one month. The Bloomberg Billionaires Index tracks the world’s 400 richest people in the world, including 26 from mainland China. Taking a look at the value of their portfolios can provide some insight as to the ride they are on. Here’s the change in wealth of billionaires in China versus those in Germany for this year:
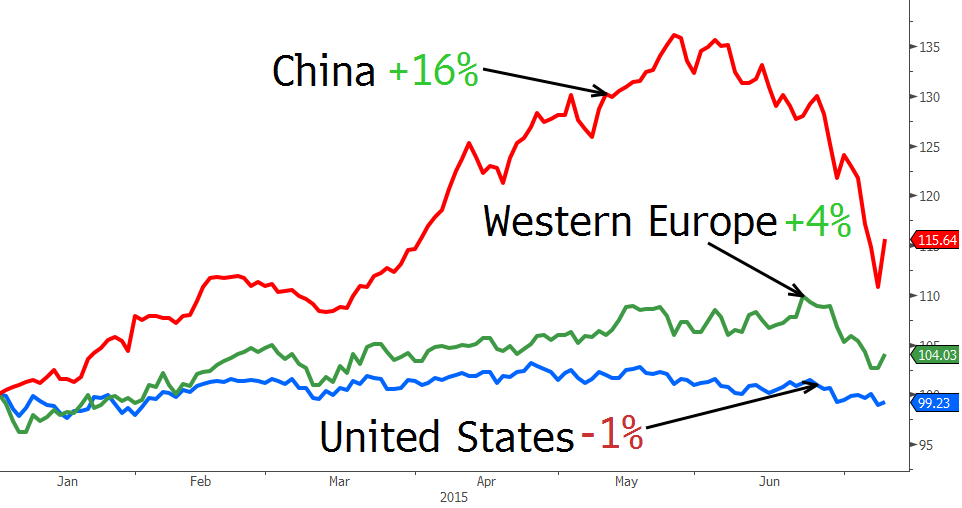
China’s ultra wealthy were up 35% from the start of the year in late May and early June. Then the market crash hit, reeling in their gains to just 10%. Since then, the stock market has had a bit of a bounce, bringing gains year-to-date to 16% as of last week:
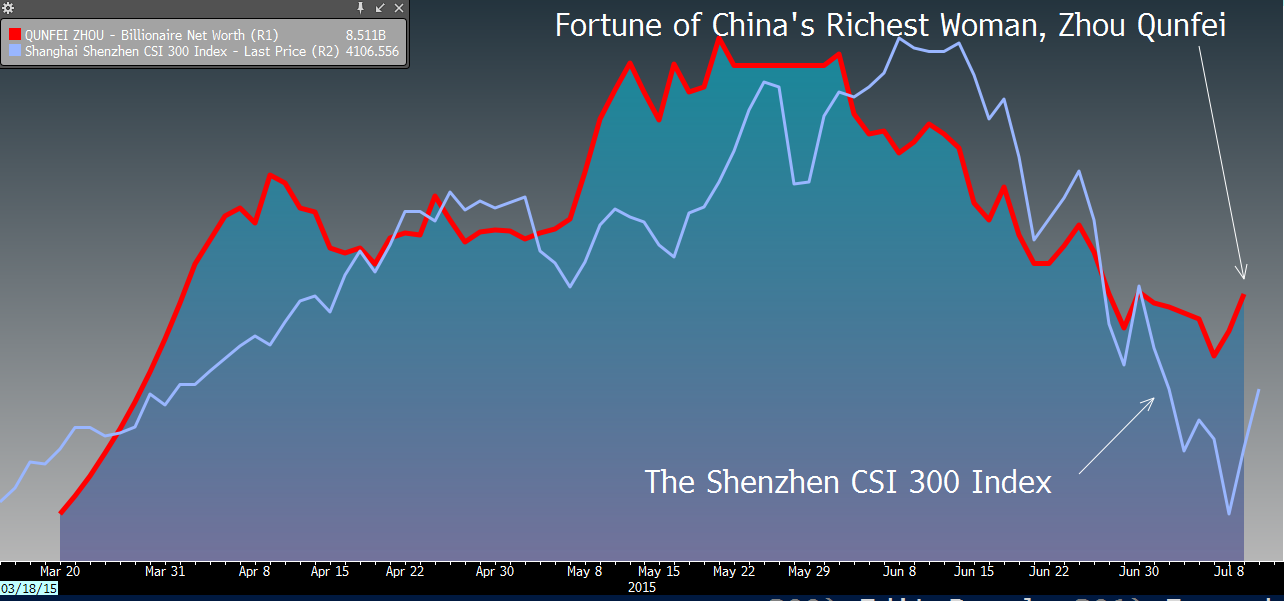
The portfolios of billionaires in the United States and Western Europe are boring in comparison. The wealthiest people in the United States have lost 1% so far in 2015, and those in Western Europe fared better with a 4% increase. Here’s the whipsaw stories of two Chinese billionaires: Zhou Qunfei Zhou Qunfei is China’s richest woman and serves as the chairman of consumer electronics supplier Lens Technology Co Ltd. Zhou’s fortune soared when Lens Technology IPO’d earlier in the year, as the stock jumped 500% in early trading. Her fortune went up to $10 billion in a matter of months. Then, with the June crash, 40% of her fortune was erased as it decreased by $5 billion.
Pan Sutong Pan Sutong is the Chinese-born chairman of the Goldin Group, a conglomerate based in Hong Kong. In January, Pan Sutong had $3.7 billion in wealth. Stock in Goldin’s subsidiaries soared, and Mr. Sutong had increased his fortune to peak at an impressive $25 billion. Since then, the stocks have gotten crushed, bringing him back to where he started: $4 billion.
The Implications of the See-Saw
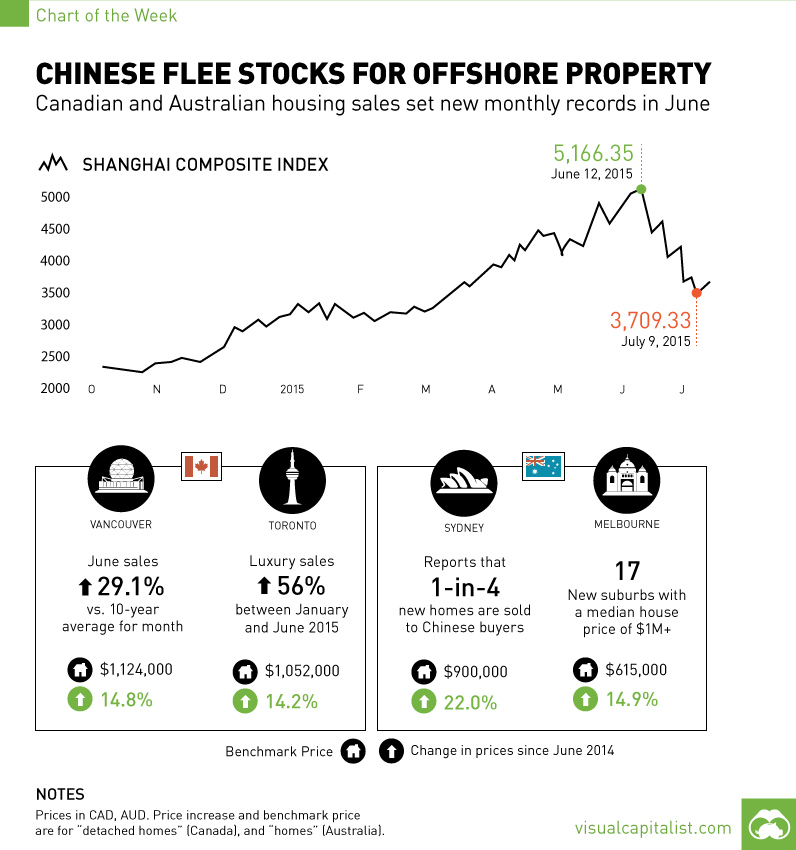
Most investors in the Chinese markets are “mom and pop” investors – Credit Suisse thinks that 80% of urban Chinese have money in stocks, and many of them don’t even have a high school education. Because of this, there is likely to still be strong volatility as this new group of investors collectively learns how to trade in the market. China’s ultra rich, meanwhile, are trying to lock in their gains by diversifying elsewhere. This is because the wealthiest people in the country have an unusual amount of wealth tied to public markets compared to the rest of the world: 66% of the wealth of billionaires in China and Hong Kong is “paper wealth” in the public markets. In the United States and Western Europe, it is less than 50%. To even out their portfolios, the ultra wealthy have sought out real estate both in China and in foreign markets. This is something we covered out in a recent Chart of the Week as Chinese investors left the volatile stock market in search for a better store of wealth. See below:
Original graphics from: Bloomberg
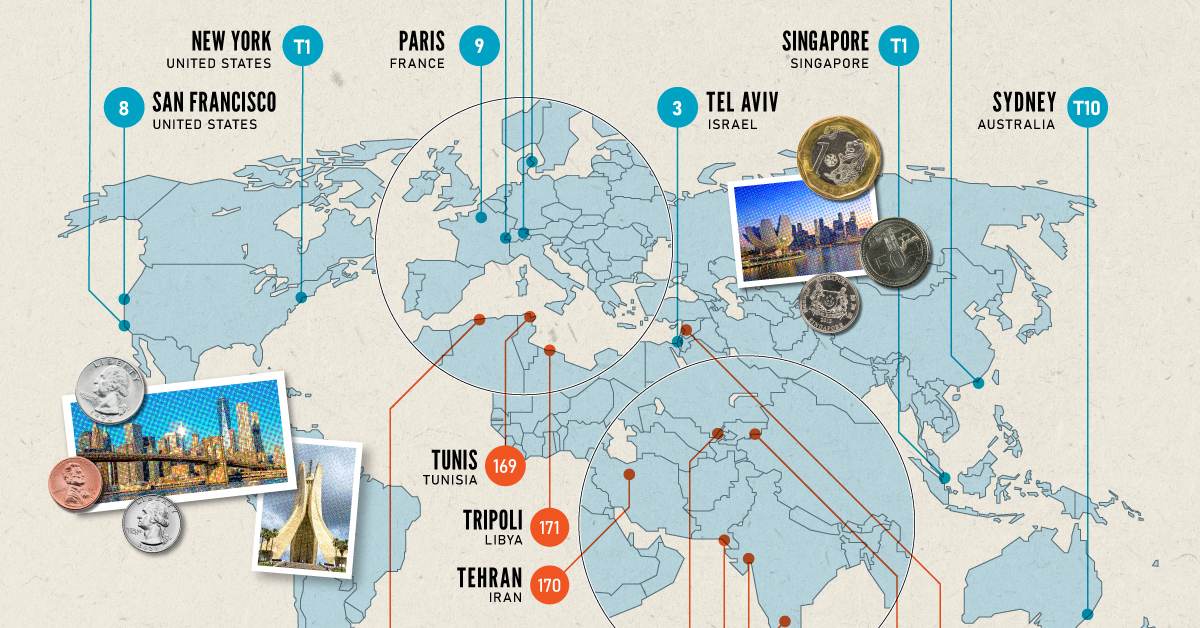
on Cities become “expensive” due to a variety of factors such as high demand for housing, a concentration of high-paying businesses and industries, and a high standard of living. Additionally, factors such as taxes, transportation costs, and availability of goods and services can also contribute to the overall cost of living in global cities. The infographic above uses data from EIU to rank the world most and least expensive cities to live in. To make the list, the EIU examines 400+ prices for over 200 products and services in 172 cities, surveying a variety of businesses to track price fluctuations over the last year.
Inflation + Strong Currency = Expensive Cities
If you live in a city where many residents find it challenging to put a roof over their heads, food on their plates, and make ends meet, you live in an expensive city. But if this inflation is compounded with a strong national currency, you may live in one of the world’s most expensive cities. Singapore and New York City tied for the first rank amongst the world’s most expensive cities in 2022, pushing Israel’s Tel Aviv from the first place in 2021 to the third place in 2022. Both these cities had high inflation and a strong currency. Surprisingly, this is the Big Apple’s first time atop the ranking. The city with one of the most expensive real estate markets worldwide, Hong Kong ranked fourth in this list, followed by Los Angeles, which moved up from its ninth rank in 2021.
Poor Economies = Cheaper Cities
Asia continues to dominate the list of the world’s least expensive cities, followed by parts of North Africa and the Middle East. Though affordability sounds good at face value, sitting at the bottom of the ranking isn’t necessarily a coveted position. While the cost of living in some of the cities in these nations is low, it comes at the price of a weak currency, poor economy, and, in many cases, political and economic turmoil. The decade-long conflict in Syria weakened the Syrian pound, led to a spiraling inflation and fuel shortages, and further collapsed its economy. It’s no surprise that its capital city of Damascus has maintained its position as the world’s cheapest city. Tripoli and Tehran, the capitals of Libya and Iran, respectively, follow next on this list, reflecting their weakened economies. Meanwhile, seven cities in Asia with the common denominator of high-income inequality and low wages dominate the list of the world’s cheapest cities. These include three Indian cities, Tashkent in Uzbekistan, Almaty in Kazakhstan, Pakistan’s most populous city of Karachi, and Sri Lankan capital–Colombo.