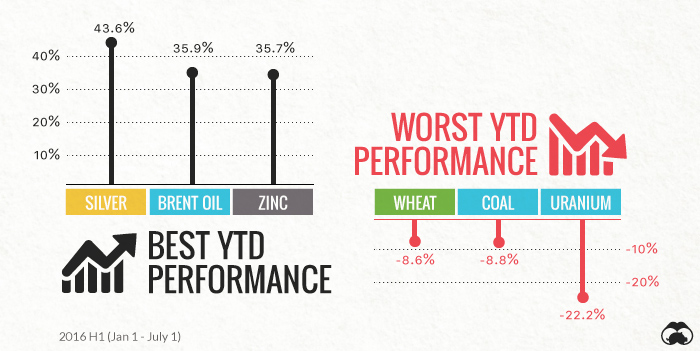
While commodity performance in Q1 was promising, it was mainly precious metals and zinc that buoyed everything else. Energy and base metals were relatively flat on the quarter, with uranium and natural gas having the biggest declines. However, the game changed considerably in Q2. We now live in a post-Brexit world, where the real risk of further contagion in Europe is prompting investors to seek insurance policies. Silver is hovering near the $20 mark, which makes it the best performing commodity of the first half of 2016 with a 43.6% return.
But it’s not just precious metals that are back in vogue. Energy had an impressive comeback in Q2, with natural gas and oil being the best performing commodities of the quarter. Base metals were up, and even the TSX Venture, a Canadian index tracking many of the world’s junior mining and energy stocks, was the best performing benchmark. This is meaningful, because it wasn’t long ago that the TSX Venture was in a mind-boggling 1,000+ day bear market.
Q2 Commodities by Subsector
Precious Metals Gold, silver, and platinum all received a significant boost post-Brexit. In the week following the June 23 referendum, they were up 6.8%, 14.3%, and 9.7% respectively. Billionaire voices envisioning a potential bull market for precious metals include Stanley Druckenmiller, George Soros, and Ray Dalio. Base Metals Base metals, which did not receive a lot of fanfare in 2015, may have finally stopped the bleeding. Copper was virtually flat in Q1, while gaining 3.9% in Q2. Meanwhile, nickel and zinc both had double-digit quarters with 13.9% and 13.1% returns respectively. Zinc is up an impressive 35.7% YTD. Energy The energy sector came back with a vengeance. Brent and WTI had their best quarters in years with 35.1% and 37.3% increases. Natural gas was the top performing commodity in Q2, jumping up 53.3% to just short of $3/MMbtu because of unanticipated summer demand. On the other side of the energy spectrum, coal had another poor quarter, dropping -9.3% in price. (In a recent set of charts, we covered the decline in coal in depth.) Food The world’s agricultural commodities had a mixed bag for performance. Wheat was the worst performer, down -9.4% on the quarter. Corn was relatively flat, and soybeans jumped up 28.6%. Chart presented by: Sierra Metals
on Last year, stock and bond returns tumbled after the Federal Reserve hiked interest rates at the fastest speed in 40 years. It was the first time in decades that both asset classes posted negative annual investment returns in tandem. Over four decades, this has happened 2.4% of the time across any 12-month rolling period. To look at how various stock and bond asset allocations have performed over history—and their broader correlations—the above graphic charts their best, worst, and average returns, using data from Vanguard.
How Has Asset Allocation Impacted Returns?
Based on data between 1926 and 2019, the table below looks at the spectrum of market returns of different asset allocations:
We can see that a portfolio made entirely of stocks returned 10.3% on average, the highest across all asset allocations. Of course, this came with wider return variance, hitting an annual low of -43% and a high of 54%.
A traditional 60/40 portfolio—which has lost its luster in recent years as low interest rates have led to lower bond returns—saw an average historical return of 8.8%. As interest rates have climbed in recent years, this may widen its appeal once again as bond returns may rise.
Meanwhile, a 100% bond portfolio averaged 5.3% in annual returns over the period. Bonds typically serve as a hedge against portfolio losses thanks to their typically negative historical correlation to stocks.
A Closer Look at Historical Correlations
To understand how 2022 was an outlier in terms of asset correlations we can look at the graphic below:
The last time stocks and bonds moved together in a negative direction was in 1969. At the time, inflation was accelerating and the Fed was hiking interest rates to cool rising costs. In fact, historically, when inflation surges, stocks and bonds have often moved in similar directions. Underscoring this divergence is real interest rate volatility. When real interest rates are a driving force in the market, as we have seen in the last year, it hurts both stock and bond returns. This is because higher interest rates can reduce the future cash flows of these investments. Adding another layer is the level of risk appetite among investors. When the economic outlook is uncertain and interest rate volatility is high, investors are more likely to take risk off their portfolios and demand higher returns for taking on higher risk. This can push down equity and bond prices. On the other hand, if the economic outlook is positive, investors may be willing to take on more risk, in turn potentially boosting equity prices.
Current Investment Returns in Context
Today, financial markets are seeing sharp swings as the ripple effects of higher interest rates are sinking in. For investors, historical data provides insight on long-term asset allocation trends. Over the last century, cycles of high interest rates have come and gone. Both equity and bond investment returns have been resilient for investors who stay the course.