Consider if the tables were turned, and you instead were reduced to half of your current income. Where would you likely make cuts to spending? The reality is that the money you have coming in has big implications on how expenses get prioritized – and so it’s interesting to see how people in different income brackets allocate what they have.
Visualizing Spending
Today’s series of graphics come to us from data visualization expert Nathan Yau at FlowingData, and they show how money is being spent by different income groups. It uses data from the 2016 Consumer Expenditure Survey, an annual survey by the Bureau of Labor Statistics. Meanwhile, embedded words in the graphics come from Yau, as he makes observations on the data.
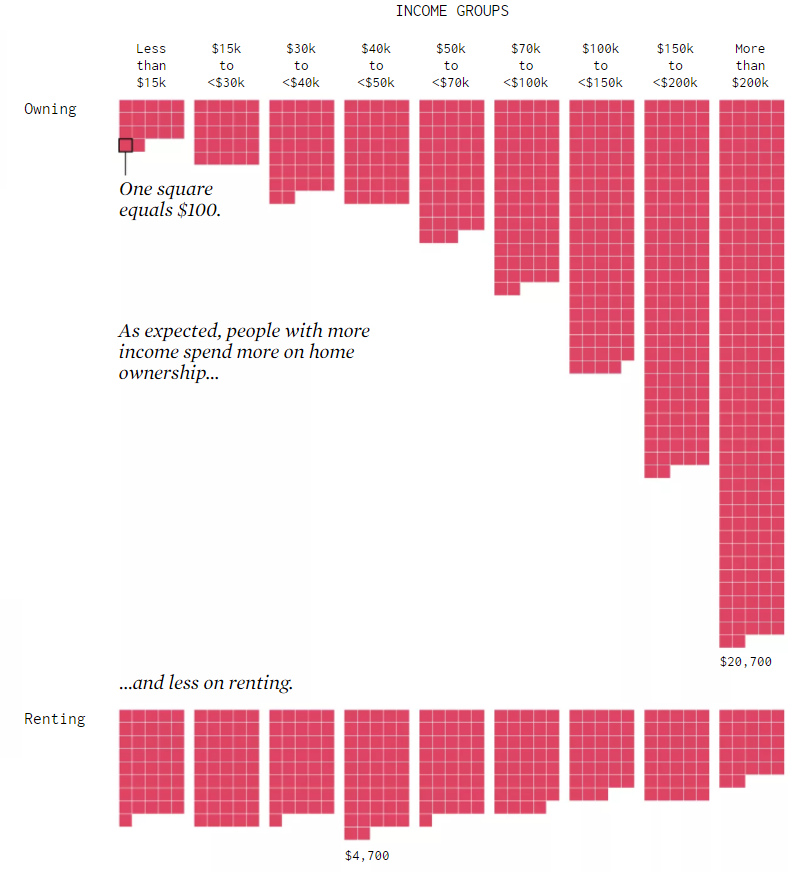
To Buy or Rent a House?
How do income groups differ in spending for housing?
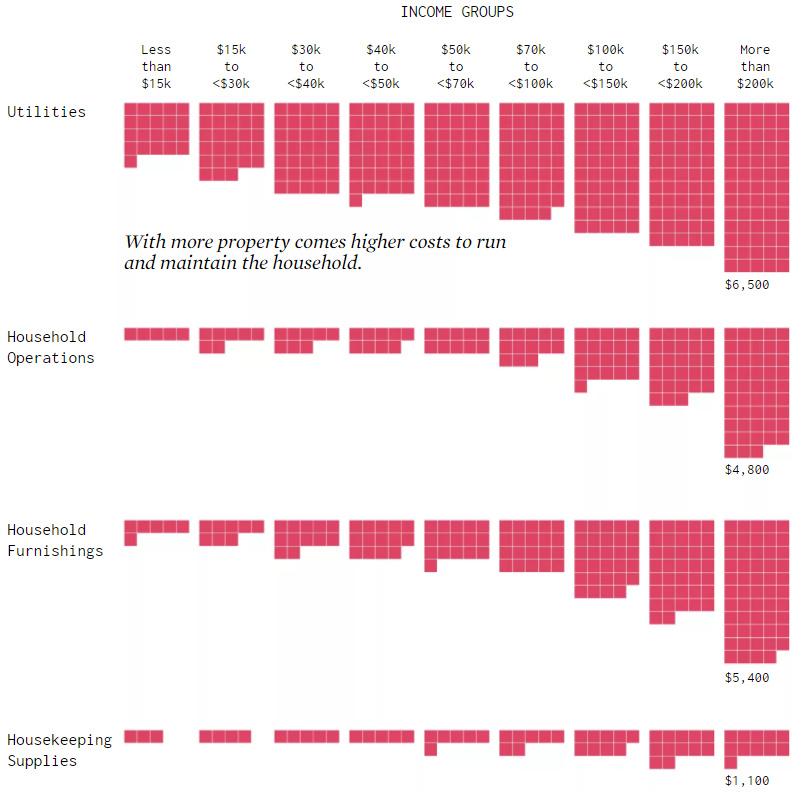
Housing Expenses
How is money spent on utilities, furniture, and other household expenses?
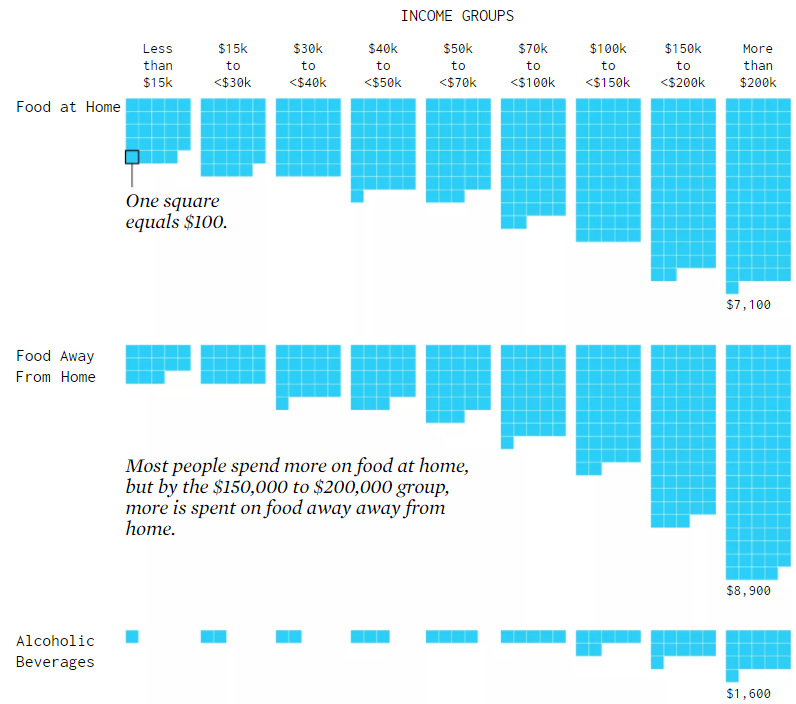
Food Expenses
Do income groups spend more eating at home, or eating out?
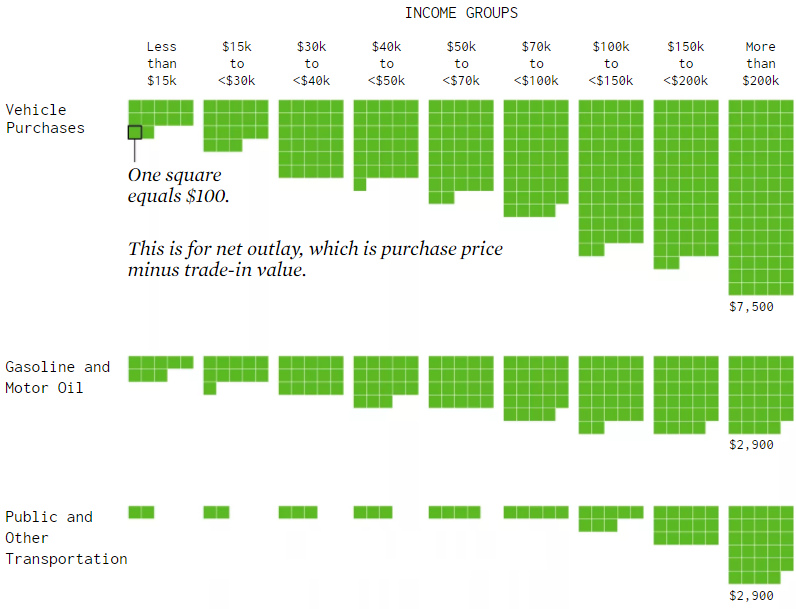
Travel and Transportation
The cost of vehicles, gas, and other travel expenses.
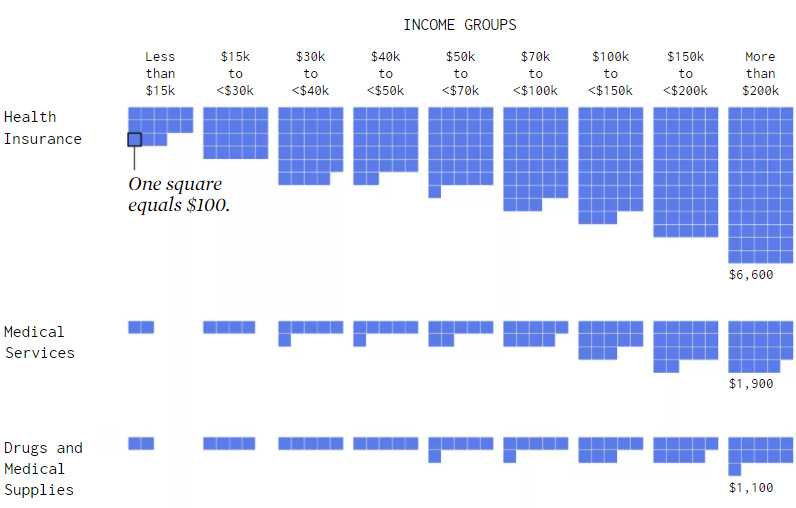
Health Expenditures
What about money spent on health insurance, services, or drugs?
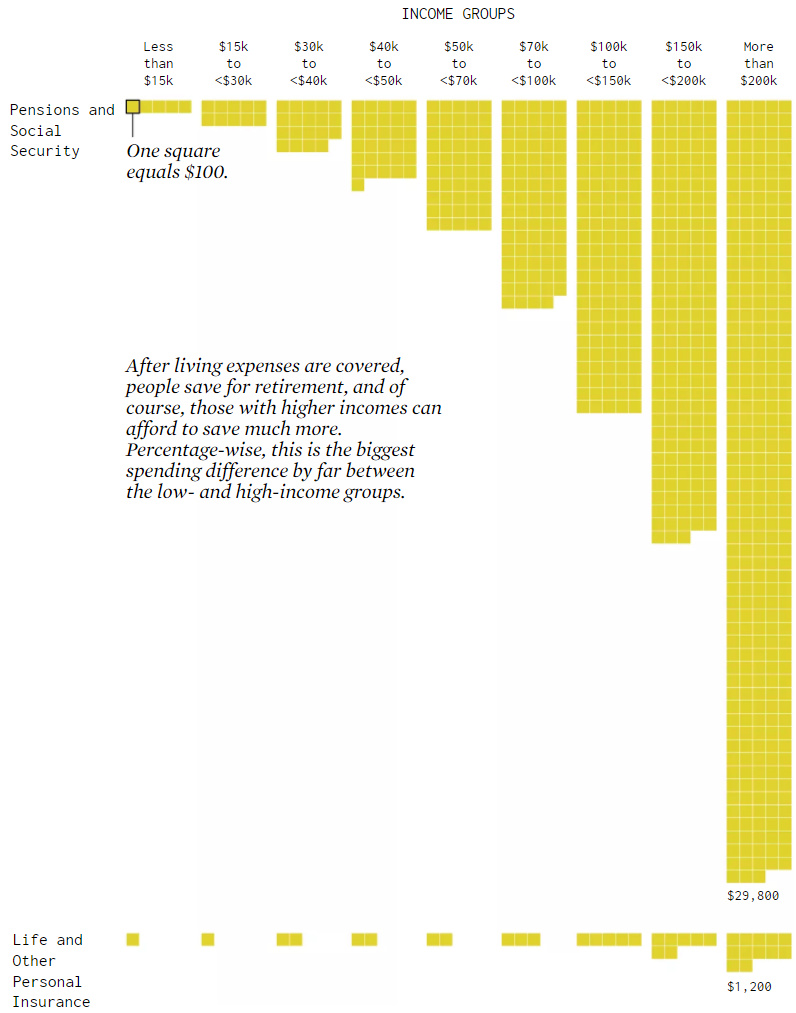
Pensions and Social Security
Lastly, the money going to retirement, pension, social security, and insurance plans.
For more data analysis, as well as many other great visualizations on income, we highly recommend checking out FlowingData. on To see how the minimum wage differs around the world, we’ve visualized data from Picodi, which includes values for 67 countries as of January 2023.
Monthly Minimum Wage, by Country
The following table includes all of the data used in this infographic. Each value represents the monthly minimum wage a full-time worker would receive in each country. Picodi states that these figures are net of taxes and have been converted to USD. Generally speaking, developed countries have a higher cost of living, and thus require a higher minimum wage. Two outliers in this dataset are Argentina and Turkey, which have increased their minimum wages by 100% or more from January 2022 levels. Turkey is suffering from an ongoing currency crisis, with the lira losing over 40% of its value in 2021. Prices of basic goods have increased considerably as the Turkish lira continues to plummet. In fact, a 2022 survey found that 70% of people in Turkey were struggling to pay for food. Argentina, South America’s second-biggest economy, is also suffering from very high inflation. In response, the country announced three minimum wage increases throughout 2022.
Minimum Wage in the U.S.
Within the U.S., minimum wage varies significantly by state. We’ve visualized each state’s basic minimum rate (hourly) using January 2023 data from the U.S. Department of Labor.
2023-03-17 Update: This map was updated to fix several incorrect values. We apologize for any confusion this may have caused. America’s federal minimum wage has remained unchanged since 2009 at $7.25 per hour. Each state is allowed to set their own minimum wage, as long as it’s higher than the federal minimum. In states that do not set their own minimum, the federal minimum applies. If we assume someone works 40 hours a week, the federal minimum wage of $7.25 translates to an annual figure of just $15,080 before taxes. California’s minimum wage of $15.50 translates to $32,240 before taxes. For further perspective, check out our 2022 infographic on the salary needed to buy a home across 50 U.S. cities.