In the first quarter of 2021, global ESG fund inflows outpaced the last four consecutive quarters, reaching $2 trillion. But while ESG gains rapid momentum, the CFA Institute shows that 33% of professional investors surveyed feel they have insufficient knowledge for considering ESG issues. To help investors understand this growing trend, this infographic from MSCI helps provide a fact check on five common ESG myths.
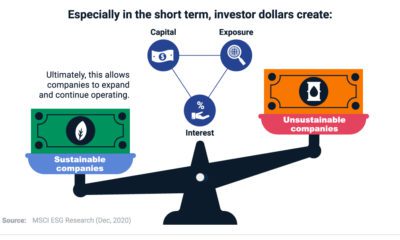
1. “ESG Comes at the Expense of Investment Performance”
Fact Check: Not necessarily
Worldwide, ESG-focused companies have not only seen higher returns, but stronger earnings growth and dividends.
Source: MSCI ESG Research LLC (Dec, 2020) *Contribution of earnings growth and dividends/buybacks to active return **Active return is the additional gain or loss compared to it respective benchmark
In fact, a separate study from the CFA Institute shows that 35% of investment professionals invest in ESG to improve their financial returns.
2. “Investors Talk About ESG But Don’t Invest In It”
Fact Check: False
Global ESG assets under management (AUM) in ETFs have grown from $6 billion in 2015 to $150 billion in 2020. In just five years, ESG AUM have accelerated 25 times.
Today, money managers are focusing on the following top five issues:
Source: US SIF Foundation (Nov, 2020)
Meanwhile, over 1,500 shareholder resolutions focused on ESG-related matters were filed between 2018-2020. Not only are investors turning to ESG assets, but they are placing higher demands on corporate responsibility.
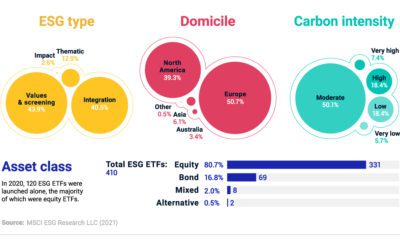
3. “ESG Investment Strategies Eliminate Entire Sectors”
Fact Check: Not necessarily First, not all ESG investment approaches are exclusionary. For instance, in North America roughly 51% of ESG ETFs used an ESG integration approach as of Dec. 31, 2020. In an ESG integration approach, ESG risks and opportunities are analyzed with the goal to support long-term returns. By comparison, values and screens approaches, which accounted for over 22% of ESG ETFs in North America may screen out specific business activities, such as alcohol or tobacco, or sectors such as oil & gas. Source: Refinitiv/Lipper and MSCI ESG Research LLC as of Dec 31, 2020 (MSCI Feb, 2021) Second, companies are assessed on a sector-specific basis where ESG leaders and laggards are identified within each sector in comparison to peers. In other words, ESG doesn’t mean eliminating exposure to entire sectors. Instead, investors can choose from a range of companies based on their ESG ratings quality.
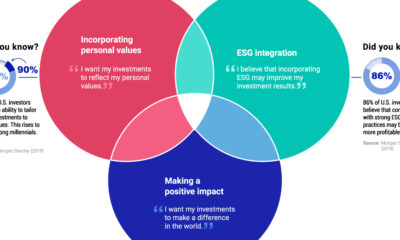
4. “ESG Investing Is Only For Millennials”
Fact Check: False
Although ESG is popular among millennials, ESG investing is being driven by the entire investor population. In 2019, one study finds that 85% of the general population expressed interest in ESG investing.
Source: US SIF Foundation (Nov, 2020)
Sustainable investing goes far beyond millennials—ESG disclosures are quickly becoming requirements for key industry participants, such as institutional investors and listed companies.
5. “ESG Investing is Here to Stay”
Fact Check: True Climbing 28% in 2020 alone, over 3,000 signatories have committed to the UN Principles of Responsible Investment. As of the first quarter of 2021, 313 global organizations and 33 asset owners have been newly added. Source: UN PRI *As of Mar, 2020 Central to ESG’s growth is the availability of ESG investments. ESG investing has become more widely accessible—which wasn’t always the case. Over the last decade, the global number of ESG ETFs has grown from 46 to 497.
Why the Facts Matter
As ESG investments continue to play an even greater role in investor portfolios, it’s important to focus on data rather than prevailing ESG myths that are not backed by fact. Given the recent momentum in investment returns and ESG adoption, data-driven evidence empowers investors to build more sustainable portfolios that better align with their investment objectives. on Last year, stock and bond returns tumbled after the Federal Reserve hiked interest rates at the fastest speed in 40 years. It was the first time in decades that both asset classes posted negative annual investment returns in tandem. Over four decades, this has happened 2.4% of the time across any 12-month rolling period. To look at how various stock and bond asset allocations have performed over history—and their broader correlations—the above graphic charts their best, worst, and average returns, using data from Vanguard.
How Has Asset Allocation Impacted Returns?
Based on data between 1926 and 2019, the table below looks at the spectrum of market returns of different asset allocations:
We can see that a portfolio made entirely of stocks returned 10.3% on average, the highest across all asset allocations. Of course, this came with wider return variance, hitting an annual low of -43% and a high of 54%.
A traditional 60/40 portfolio—which has lost its luster in recent years as low interest rates have led to lower bond returns—saw an average historical return of 8.8%. As interest rates have climbed in recent years, this may widen its appeal once again as bond returns may rise.
Meanwhile, a 100% bond portfolio averaged 5.3% in annual returns over the period. Bonds typically serve as a hedge against portfolio losses thanks to their typically negative historical correlation to stocks.
A Closer Look at Historical Correlations
To understand how 2022 was an outlier in terms of asset correlations we can look at the graphic below:
The last time stocks and bonds moved together in a negative direction was in 1969. At the time, inflation was accelerating and the Fed was hiking interest rates to cool rising costs. In fact, historically, when inflation surges, stocks and bonds have often moved in similar directions. Underscoring this divergence is real interest rate volatility. When real interest rates are a driving force in the market, as we have seen in the last year, it hurts both stock and bond returns. This is because higher interest rates can reduce the future cash flows of these investments. Adding another layer is the level of risk appetite among investors. When the economic outlook is uncertain and interest rate volatility is high, investors are more likely to take risk off their portfolios and demand higher returns for taking on higher risk. This can push down equity and bond prices. On the other hand, if the economic outlook is positive, investors may be willing to take on more risk, in turn potentially boosting equity prices.
Current Investment Returns in Context
Today, financial markets are seeing sharp swings as the ripple effects of higher interest rates are sinking in. For investors, historical data provides insight on long-term asset allocation trends. Over the last century, cycles of high interest rates have come and gone. Both equity and bond investment returns have been resilient for investors who stay the course.