Now, rising inflation and interest rates, and a possible recession on the horizon are bringing these societal divides into sharp focus. In the above visualization, U.S. households are parsed out into a neighborhood of 100 homes and then grouped by income brackets, using recent data from the U.S. Census Bureau.
The Neighborhood Breakdown
American households vary widely on their respective incomes. The largest cluster of homes, representing nearly 20% of all American households, are in the $25-$49.9k income bracket. Here’s a look at the share of households in each income bracket and the number of homes they represent. In our hypothetical neighborhood, 18 of the households are in the lowest income bracket. People in this category have a wide variety of jobs, but personal care aides, cashiers, food and beverage positions are some of the most common. As a point of reference, the poverty line for a family of four currently sits at $26,496. On the flip side, in this small community of 100 houses, 33 earn six figures and typically have at least one family member in a corporate or medical role.
The American Middle Class
The middle class in America has shrunk significantly in the past 50 years, going from 61% of adults being middle income in 1971 to 50% in 2021. Here’s a look at the economic class breakdowns by annual household income, based on households with three people (Note: the average U.S. household has 2.6 people):
Upper class: >$156,000 Middle class: $52,000-$156,000 Lower class: <$52,000
Although these definitions and conditions don’t align exactly with the buckets we use in the main houses visualization, they come pretty close. In the neighborhood of 100 homes, 38 homes could be considered low income, while 18 are high income. Meanwhile, sitting in the $50-149.9k middle range of household income are 44 homes.
The Larger Trends
The pandemic had an extremely adverse impact on earnings and income worldwide, and the U.S. was no exception. Median household income decreased 2.9% to $67.5k between 2019 and 2020, the first decrease since 2014. Additionally, the number of people who worked full-time jobs, year-round decreased by around 13.7 million. That said, when looking at the longer-term trend, the median income for those considered middle class has jumped by 50% over the last five decades. Here’s a look at the median incomes in each economic class in 1970 vs. 2020: With a recession highly likely to occur in the U.S., and rising inflation causing increases in the cost of basic, everyday goods, budgets may get tighter for many households in America, and incomes are likely to be impacted as well. on A lagging stock market dented these fortunes against high interest rates, energy shocks, and economic uncertainty. But some of the world’s billionaires have flourished in this environment, posting sky-high revenues in spite of inflationary pressures. With data from Forbes Real-Time Billionaires List, we feature a snapshot of the richest people in the world in 2023.
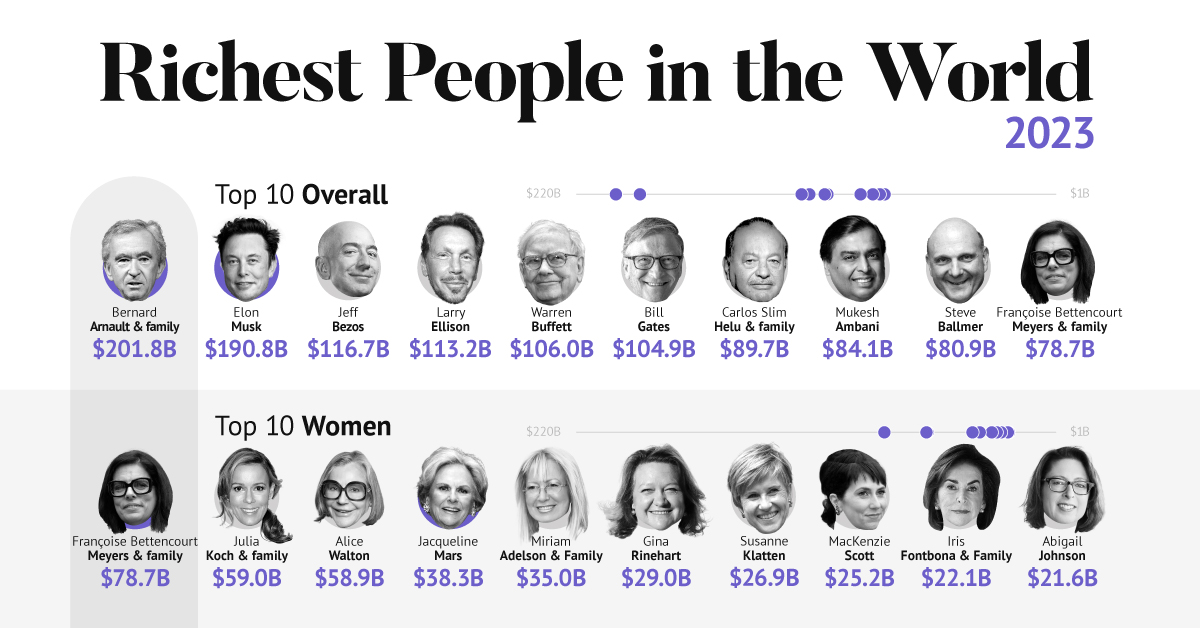
Luxury Mogul Takes Top Spot
The world’s richest person is France’s Bernard Arnault, the chief executive of LVMH.
With 75 brands, the luxury conglomerate owns Louis Vuitton, Christian Dior, and Tiffany. LVMH traces back to 1985, when Arnault cut his first major deal with the company by acquiring Christian Dior, a firm that was struggling with bankruptcy.
Fast-forward to today, and the company is seeing record profits despite challenging market conditions. Louis Vuitton, for instance, has doubled its sales in four years.
In the table below, we show the world’s 10 richest people with data as of February 27, 2023:
Elon Musk, the second-wealthiest person in the world has a net worth of $191 billion. In October, Musk took over Twitter in a $44 billion dollar deal, which has drawn criticism from investors. Many say it’s a distraction from Musk’s work with Tesla.
While Tesla shares have rebounded—after falling roughly 70% in 2022—Musk’s wealth still sits about 13% lower than in March of last year.
Third on the list is Jeff Bezos, followed by Larry Ellison. The latter of the two, who founded Oracle, owns 98% of the Hawaiian island of Lanai which he bought in 2012 for $300 million.
Fifth on the list is Warren Buffett. In his annual letter to shareholders, he discussed how Berkshire Hathaway reported record operating profits despite economic headwinds. The company outperformed the S&P 500 Index by about 22% in 2022.
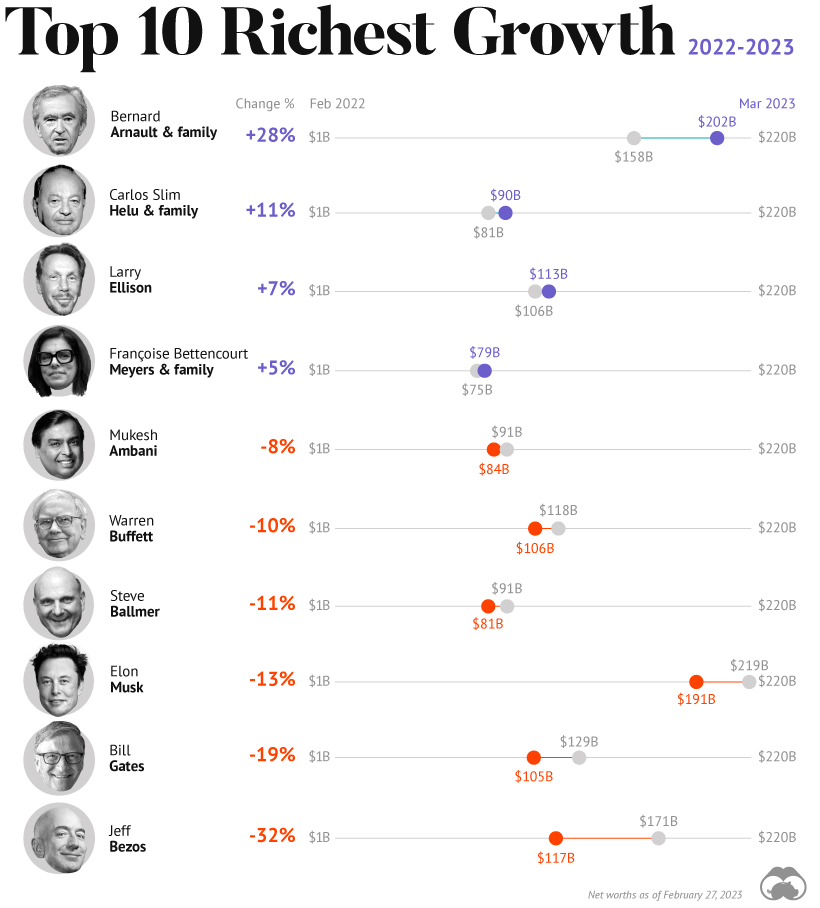
How Fortunes Have Changed
Given multiple economic crosscurrents, billionaire wealth has diverged over the last year. Since March 2022, just four of the top 10 richest in the world have seen their wealth increase. Two of these are European magnates, while Carlos Slim Helu runs the largest telecom firm in Latin America. In fact, a decade ago Slim was the richest person on the planet. Overall, as the tech sector saw dismal returns over the year, the top 10 tech billionaires lost almost $500 billion in combined wealth.
Recent Shakeups in Asia
Perhaps the most striking news for the world’s richest centers around Gautam Adani, formerly the richest person in Asia. In January, Hindenburg Research, a short-selling firm, released a report claiming that the Adani Group engaged in stock manipulation and fraud. Specifically, the alleged the firm used offshore accounts to launder money, artificially boost share prices, and hide losses. The Adani Group, which owns India’s largest ports—along with ports in Australia, Sri Lanka, and Israel—lost $100 billion in value in the span of a few weeks. Interestingly, very few Indian mutual funds hold significant shares in Adani Group, signaling a lack of confidence across India’s market, which was also cited in Hindenburg’s report. As a result, Mukesh Ambani has climbed to Asia’s top spot, controlling a $84 billion empire that spans from oil and gas and renewable energy to telecom. His conglomerate, Reliance Industries is the largest company by market cap in India.


title: “Household Income Distribution In The U S Visualized As 100 Homes” ShowToc: true date: “2023-03-01” author: “Les Harwood”
Inequality in America has become a major talking point in recent years. For many people though, the concept of inequality – the idea that wealth is spread very thinly at the lower end of the socioeconomic ladder – is still an abstract concept. There are over 125 million households in the United States, each with their own unique structure and financial situation, so understanding such a complex issue requires reducing it to proportions we can understand.
American Households as a Neighborhood
In the visualization above, American households are distilled down into 100 homes, then color-coded into $25,000 income increments. One house is allocated for those making $300,000 and more per year. On the other end of the scale, we can see that 24 of the households earn $25,000 per year or less, and nearly half of the households have an annual income lower than $50,000. Here is a more granular breakdown of numbers, this time from a slightly different data source (U.S. Census Bureau’s 2017 Household Income Survey): Households between $35,000 and $100,000 are generally considered middle class. That said, the geographical location of where a household is located also makes a big difference.
The Power of Place
Not surprisingly, cost of living strongly influences your household’s place on the income spectrum. In El Paso, Texas, a $50,000 income places a household of four people in the middle class. However, in a more expensive metro area, like San Diego, that same income lands your household in a lower income tier. Here’s a closer look at the cost of typical expenses in the two metros: Source: Bankrate.com
Mixed Messages
The median household income in the U.S. continues setting new monthly records, and we’ve just seen this decade’s largest year-over-year increase in individual wages. One side effect of this economic growth is that households in the top wage bracket – the well-appointed yellow square in our visualization – have a tendency to reap outsized rewards. So, for now, as America’s economy trends upward, so does its Gini Coefficient. on To see how the minimum wage differs around the world, we’ve visualized data from Picodi, which includes values for 67 countries as of January 2023.
Monthly Minimum Wage, by Country
The following table includes all of the data used in this infographic. Each value represents the monthly minimum wage a full-time worker would receive in each country. Picodi states that these figures are net of taxes and have been converted to USD. Generally speaking, developed countries have a higher cost of living, and thus require a higher minimum wage. Two outliers in this dataset are Argentina and Turkey, which have increased their minimum wages by 100% or more from January 2022 levels. Turkey is suffering from an ongoing currency crisis, with the lira losing over 40% of its value in 2021. Prices of basic goods have increased considerably as the Turkish lira continues to plummet. In fact, a 2022 survey found that 70% of people in Turkey were struggling to pay for food. Argentina, South America’s second-biggest economy, is also suffering from very high inflation. In response, the country announced three minimum wage increases throughout 2022.
Minimum Wage in the U.S.
Within the U.S., minimum wage varies significantly by state. We’ve visualized each state’s basic minimum rate (hourly) using January 2023 data from the U.S. Department of Labor.
2023-03-17 Update: This map was updated to fix several incorrect values. We apologize for any confusion this may have caused. America’s federal minimum wage has remained unchanged since 2009 at $7.25 per hour. Each state is allowed to set their own minimum wage, as long as it’s higher than the federal minimum. In states that do not set their own minimum, the federal minimum applies. If we assume someone works 40 hours a week, the federal minimum wage of $7.25 translates to an annual figure of just $15,080 before taxes. California’s minimum wage of $15.50 translates to $32,240 before taxes. For further perspective, check out our 2022 infographic on the salary needed to buy a home across 50 U.S. cities.


