The Federal Reserve’s accommodative monetary policy, supply chain struggles, and high demand for fuels and raw materials for the clean energy transition largely shaped the markets. Alongside the rise in inflation, commodities and cryptocurrency outperformed as broad equity indices saw double-digit returns, with the S&P 500 rising by 26.9% in 2021.
Markets Roundup for 2021
Speculation and the energy fuels for the world’s reopening were two of the main themes for markets in 2021, reflected in Bitcoin (59.8%) and crude oil (56.4%) being the top two performing assets in that time frame. The S&P GSCI commodity index (37.1%) was another top performer, as agricultural and livestock food prices rose alongside the Dow Jones Real Estate Index (35.1%). Source: TradingView Despite most physical and digital commodities seeing price gains, precious metals such as gold (-3.6%) and silver (-11.7%) struggled to hold onto their value, while industrial and battery metals like lithium (477.4%) and cobalt (207.7%) surged. Large cap equity indices like the S&P 500 (26.9%) almost doubled the returns of small caps (Russell 2000, 13.7%), with emerging markets failing to keep up as they fell 5.5%.
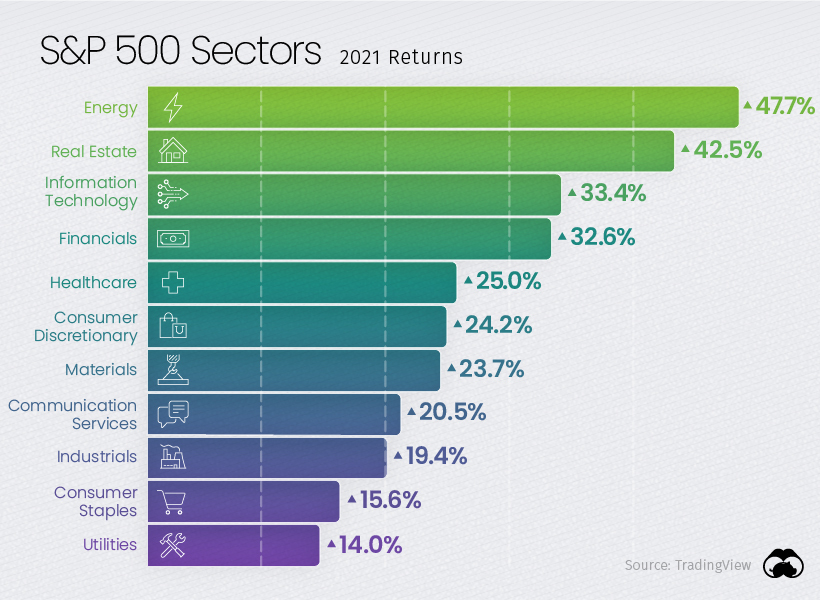
How the S&P 500 Sectors Performed
After last year’s poor performance as the worst-performing S&P 500 sector, energy (47.7%) was 2021’s best performing sector alongside the rise in crude oil and other energy commodities. Two other negative performers last year, real estate (42.5%) and financials (32.6%), also turned it around and were among the top performing sectors this year.
Despite many value equities performing well, growth equities still managed to keep a strong pace. Information technology (33.4%) continued to provide strong returns with Microsoft (51.2%) outperforming many of the other tech giants.
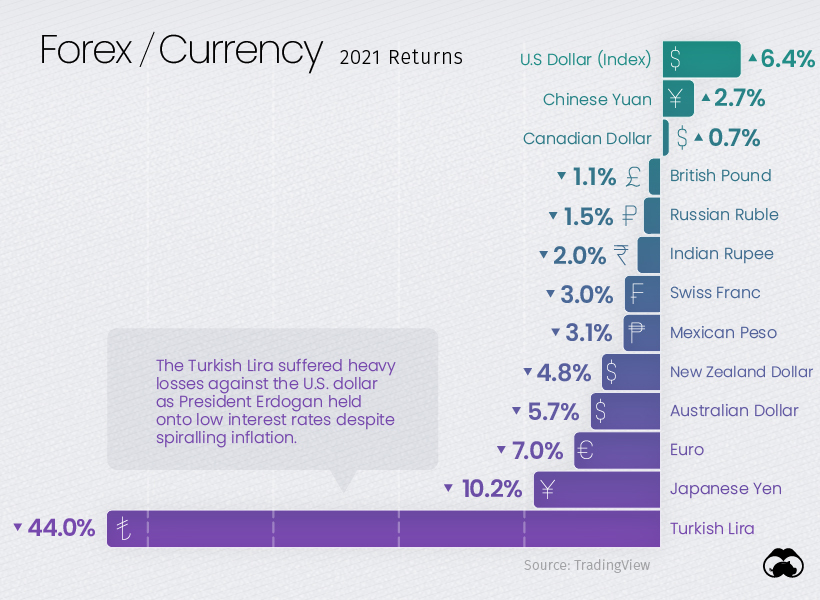
Foreign Exchange and Currency Returns in 2021
While the U.S. dollar struggled last year with most currencies outperforming it, 2021 saw the dollar index rise by 6.4%, outperforming most other currencies. The Chinese yuan (2.7%) and Canadian dollar (0.7%) were the only major currencies that managed positive returns against the U.S. dollar, while the Australian dollar (-5.7%), Euro (-7.0%), and Japanese Yen (-10.2%) were among the worst performers.
The Turkish lira was the standout loser in foreign exchange, and the turmoil was punctuated by turnover in the country’s finance minister position. While most other emerging economies raised interest rates to fight against inflation, Turkey has continued cutting rates and looks set to default on its $446 million of external debt.
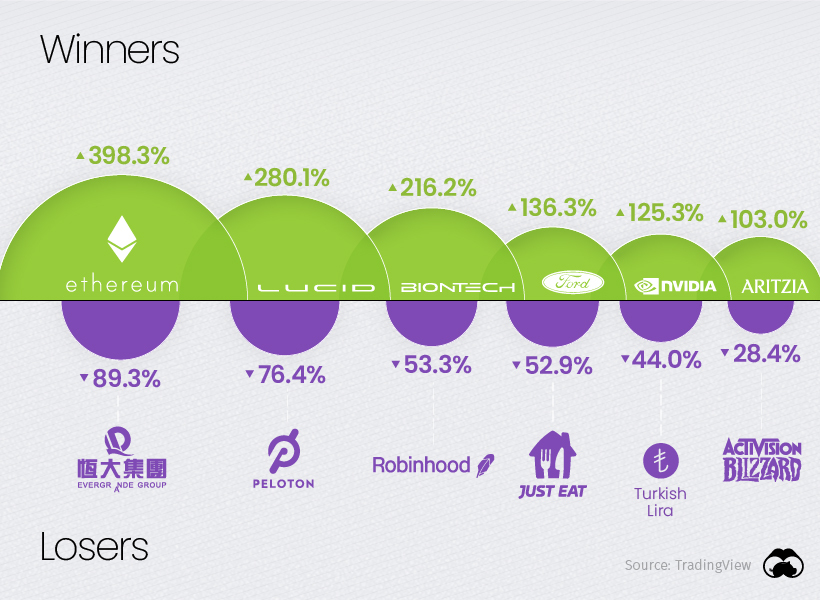
The Winners and Losers of 2021
As the COVID-19 pandemic defined many of the winners and losers in 2020, the gradual reopening of international travel and business shaped the over and underperformers of 2021. Cryptocurrencies had a standout year beyond Bitcoin (59.8%), which was greatly outpaced by many other cryptocurrencies and smart contract platforms like Ethereum (398.3%), Solana (11,177.8%), Avalanche (3,334.8%), and Luna (12,967.3%). While Tesla (49.8%) had another strong year, Lucid and Ford Motors greatly outperformed Elon Musk’s company and the rest of the auto industry with their EV efforts. Demand was so great that Ford had to halt reservations for its F-150 Lightning pickup trucks at the end of 2021.
The pain of Evergrande Group (89.3%) shareholders is set to end soon, with the company starting 2022 by halting shares in Hong Kong as its $300 billion in liabilities remain in limbo. Peloton (-76.4%) was another big loser in 2021 as it gave back nearly all of its gains from last year, proving lockdown speculation fueled most of its former valuation. Just Eat (-52.9%) was similarly hit hard as restaurants reopened in 2021. Robinhood’s (53.3%) weak performance since its IPO puts a bow on 2021’s retail “stonk” frenzy kicked off by the Wall Street Bets subreddit. With 2021 being a breakout year for retail traders and investors online, we’ll see if 2022 remains risk-on as the Fed begins tapering, or if markets are due for a change in direction. on Last year, stock and bond returns tumbled after the Federal Reserve hiked interest rates at the fastest speed in 40 years. It was the first time in decades that both asset classes posted negative annual investment returns in tandem. Over four decades, this has happened 2.4% of the time across any 12-month rolling period. To look at how various stock and bond asset allocations have performed over history—and their broader correlations—the above graphic charts their best, worst, and average returns, using data from Vanguard.
How Has Asset Allocation Impacted Returns?
Based on data between 1926 and 2019, the table below looks at the spectrum of market returns of different asset allocations:
We can see that a portfolio made entirely of stocks returned 10.3% on average, the highest across all asset allocations. Of course, this came with wider return variance, hitting an annual low of -43% and a high of 54%.
A traditional 60/40 portfolio—which has lost its luster in recent years as low interest rates have led to lower bond returns—saw an average historical return of 8.8%. As interest rates have climbed in recent years, this may widen its appeal once again as bond returns may rise.
Meanwhile, a 100% bond portfolio averaged 5.3% in annual returns over the period. Bonds typically serve as a hedge against portfolio losses thanks to their typically negative historical correlation to stocks.
A Closer Look at Historical Correlations
To understand how 2022 was an outlier in terms of asset correlations we can look at the graphic below:
The last time stocks and bonds moved together in a negative direction was in 1969. At the time, inflation was accelerating and the Fed was hiking interest rates to cool rising costs. In fact, historically, when inflation surges, stocks and bonds have often moved in similar directions. Underscoring this divergence is real interest rate volatility. When real interest rates are a driving force in the market, as we have seen in the last year, it hurts both stock and bond returns. This is because higher interest rates can reduce the future cash flows of these investments. Adding another layer is the level of risk appetite among investors. When the economic outlook is uncertain and interest rate volatility is high, investors are more likely to take risk off their portfolios and demand higher returns for taking on higher risk. This can push down equity and bond prices. On the other hand, if the economic outlook is positive, investors may be willing to take on more risk, in turn potentially boosting equity prices.
Current Investment Returns in Context
Today, financial markets are seeing sharp swings as the ripple effects of higher interest rates are sinking in. For investors, historical data provides insight on long-term asset allocation trends. Over the last century, cycles of high interest rates have come and gone. Both equity and bond investment returns have been resilient for investors who stay the course.