Hundreds of millions of people have been lifted out of poverty, and China’s swelling middle class has attracted the interest of Western companies. As many American companies have discovered, doing business in China is far from straightforward. Recent history is littered with examples of companies that entered the Chinese market to great fanfare, only to retreat a few years later.
Calling Off The Offensive
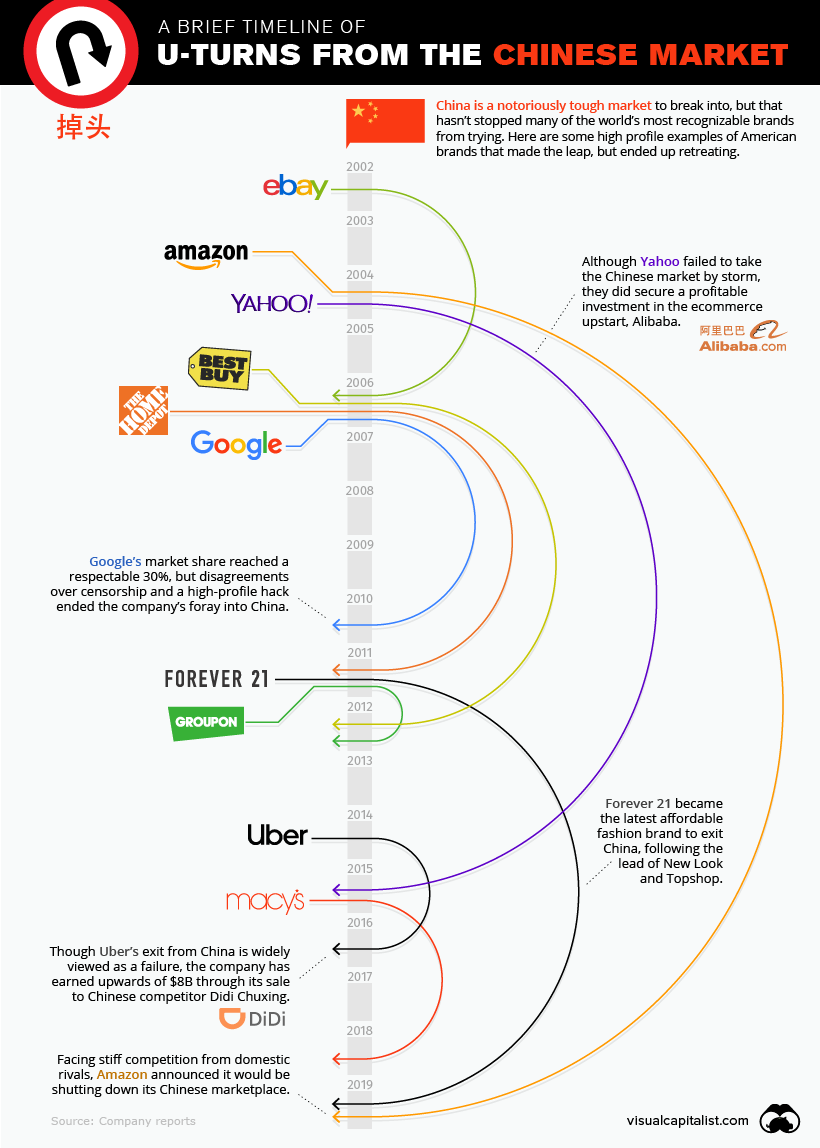
Today’s infographic highlights 11 companies that ended up tapping the brakes on their ambitious forays on the other side of the Pacific. Then, we take a look at the factors that influenced these strategic withdrawals.
Here are some high profile examples of corporate u-turns by American companies operating in the Chinese market:
When Google China’s search engine was launched in 2006, the company had made the controversial decision to censor search results within the country. Google publicly displayed a disclaimer indicating that some results were removed, which created tensions with the Chinese government. For a while, things seemed to be going well. Even though a domestic company, Baidu, had captured the majority of the Chinese search market, Google did have a respectable market share of about 30%. Google China’s fortune took a turn for the worse in 2010 after a major hack – Operation Aurora – exposed user data as well as intellectual property. The hack, which originated from within China, was the last straw for Google’s executive team. After one last ditch effort to provide unfiltered search results within China, the company retreated beyond the firewall.
Uber
After arriving fashionably late for the ride-hailing party in 2014, it quickly became clear that Uber was facing an uphill battle against well-funded domestic rivals. After only two years, Uber elected to u-turn out of the Chinese market. Though Uber’s tactical exit from China is often viewed as a failure, the company has earned upwards of $8B through its sale to competitor Didi Chuxing.
A Two-Way Street
Now that red-hot growth at home is beginning to taper off, a number of Chinese companies have begun their push into other markets around the world. Much like their American counterparts, brands pushing beyond China’s borders are seeing varied success in their expansion efforts. One high-profile example is Huawei. The telecommunications giant has been making inroads in countries around the world – particularly in emerging markets – but has seen pushback and scrutiny in a number of developed economies. Huawei has become a lightning rod for growing concerns over government surveillance and China’s growing influence over the global communications network. Already, Australia has blocked the company from participating in its 5G network, and in the United States, government agencies are banned from buying Huawei gear. If negative sentiment continues to build, it remains to be seen whether Huawei and other Chinese companies will follow the playbook of American brands in China, and turn the car around. on Last year, stock and bond returns tumbled after the Federal Reserve hiked interest rates at the fastest speed in 40 years. It was the first time in decades that both asset classes posted negative annual investment returns in tandem. Over four decades, this has happened 2.4% of the time across any 12-month rolling period. To look at how various stock and bond asset allocations have performed over history—and their broader correlations—the above graphic charts their best, worst, and average returns, using data from Vanguard.
How Has Asset Allocation Impacted Returns?
Based on data between 1926 and 2019, the table below looks at the spectrum of market returns of different asset allocations:
We can see that a portfolio made entirely of stocks returned 10.3% on average, the highest across all asset allocations. Of course, this came with wider return variance, hitting an annual low of -43% and a high of 54%.
A traditional 60/40 portfolio—which has lost its luster in recent years as low interest rates have led to lower bond returns—saw an average historical return of 8.8%. As interest rates have climbed in recent years, this may widen its appeal once again as bond returns may rise.
Meanwhile, a 100% bond portfolio averaged 5.3% in annual returns over the period. Bonds typically serve as a hedge against portfolio losses thanks to their typically negative historical correlation to stocks.
A Closer Look at Historical Correlations
To understand how 2022 was an outlier in terms of asset correlations we can look at the graphic below:
The last time stocks and bonds moved together in a negative direction was in 1969. At the time, inflation was accelerating and the Fed was hiking interest rates to cool rising costs. In fact, historically, when inflation surges, stocks and bonds have often moved in similar directions. Underscoring this divergence is real interest rate volatility. When real interest rates are a driving force in the market, as we have seen in the last year, it hurts both stock and bond returns. This is because higher interest rates can reduce the future cash flows of these investments. Adding another layer is the level of risk appetite among investors. When the economic outlook is uncertain and interest rate volatility is high, investors are more likely to take risk off their portfolios and demand higher returns for taking on higher risk. This can push down equity and bond prices. On the other hand, if the economic outlook is positive, investors may be willing to take on more risk, in turn potentially boosting equity prices.
Current Investment Returns in Context
Today, financial markets are seeing sharp swings as the ripple effects of higher interest rates are sinking in. For investors, historical data provides insight on long-term asset allocation trends. Over the last century, cycles of high interest rates have come and gone. Both equity and bond investment returns have been resilient for investors who stay the course.