A little more than you may think. In fact, both have been known to be fond of a very particular charting technique to describe trading sessions. Today, we call this style of stock chart a candlestick chart, and it is regularly used by investors and technical traders to gauge the momentum of securities.
Candlestick Charts
Today’s infographic comes to us from Hantec Markets, and it provides an introduction to how candlestick charts work. Further, it explains some common patterns, and how they are generally interpreted by investors.
Candlestick charts are often used by traders to help interpret the day-to-day sentiment behind a security. If the sentiment changes, a trend reversal may be in store – and an opportunity to take advantage could be in sight.
The Basics
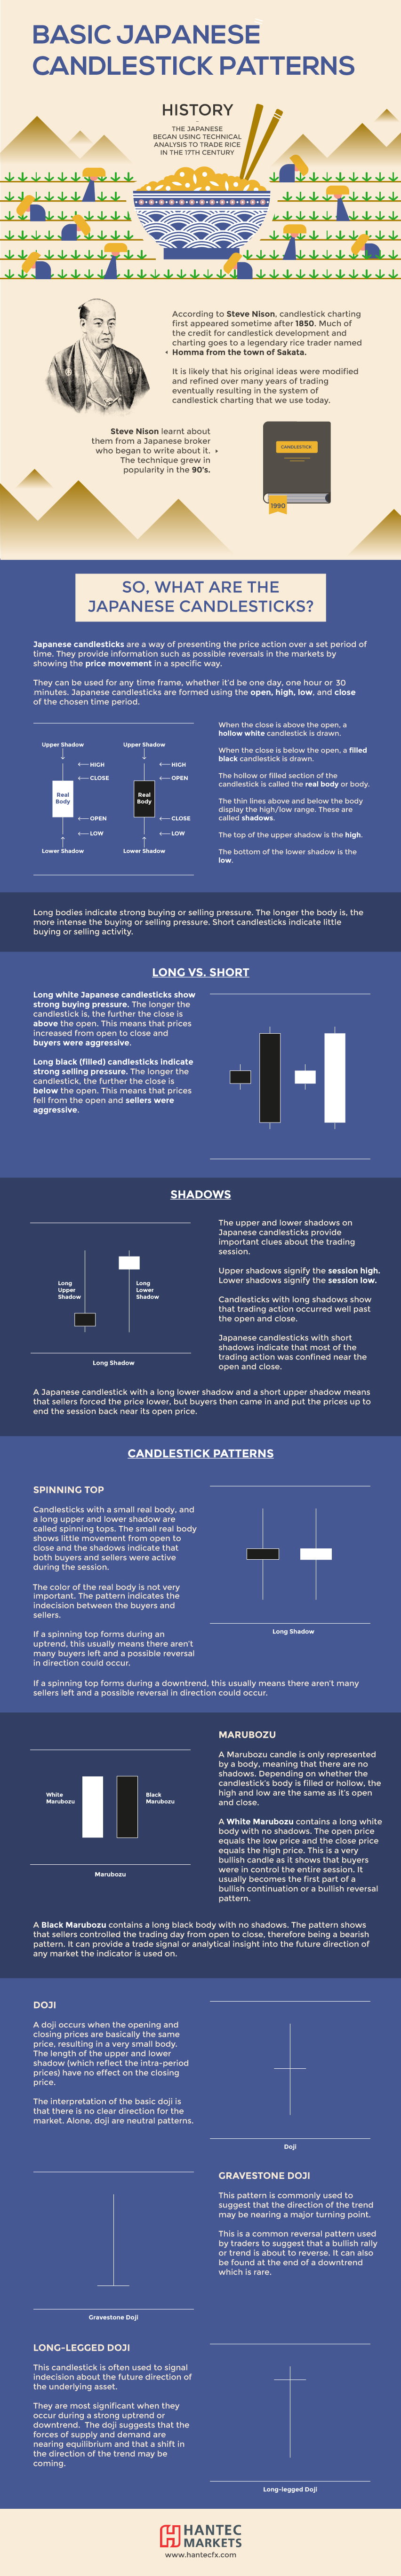
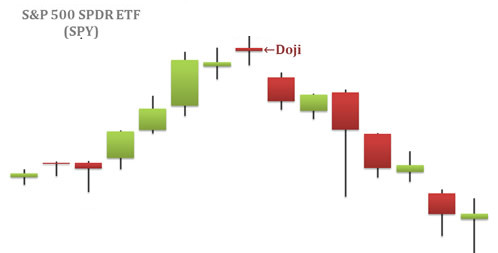
Candlestick charts show the price action of a security over time, and each individual candlestick indicates four pieces of data for a particular session: the high, open, close, and low price for a security.
Meanwhile, the color of the candlestick indicates the direction of the session: white means the close was higher than the open (bullish), while black means the close was lower than the open (bearish). Note: it’s common to see candlesticks charted using green and red colors, as well.
Patterns Worth Knowing
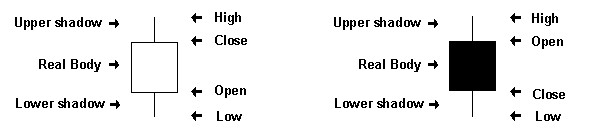
While recognizable trading patterns with candlestick charts can get complex, there are some important nuts and bolts to consider beforehand: Spinning Top: These have long shadows and short bodies, taking the shape of a spinning top toy. They can be interpreted as indecisive periods of trading – and if following a long uptrend or downtrend, could be seen as showing the bulls (or bears) losing control.
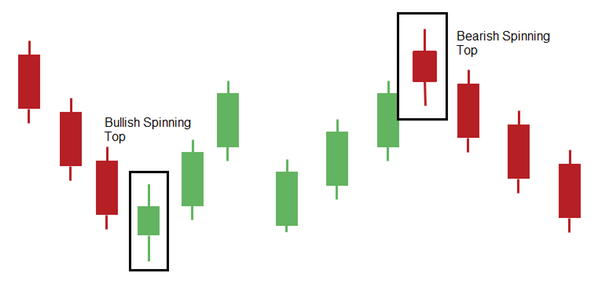
Marubozu: A marubozu is only represented by a body, meaning the high and low are the same as the open and close. In other words, these are very bullish or bearish, depending on their color.
Doji: A doji is when the opening and closing price are the same, resulting in a small body.
These are just the most basic formations, and it’s possible to dive into candlestick charts much deeper. Here’s a simple primer that reviews the above, but takes things a step further.
on Last year, stock and bond returns tumbled after the Federal Reserve hiked interest rates at the fastest speed in 40 years. It was the first time in decades that both asset classes posted negative annual investment returns in tandem. Over four decades, this has happened 2.4% of the time across any 12-month rolling period. To look at how various stock and bond asset allocations have performed over history—and their broader correlations—the above graphic charts their best, worst, and average returns, using data from Vanguard.
How Has Asset Allocation Impacted Returns?
Based on data between 1926 and 2019, the table below looks at the spectrum of market returns of different asset allocations:
We can see that a portfolio made entirely of stocks returned 10.3% on average, the highest across all asset allocations. Of course, this came with wider return variance, hitting an annual low of -43% and a high of 54%.
A traditional 60/40 portfolio—which has lost its luster in recent years as low interest rates have led to lower bond returns—saw an average historical return of 8.8%. As interest rates have climbed in recent years, this may widen its appeal once again as bond returns may rise.
Meanwhile, a 100% bond portfolio averaged 5.3% in annual returns over the period. Bonds typically serve as a hedge against portfolio losses thanks to their typically negative historical correlation to stocks.
A Closer Look at Historical Correlations
To understand how 2022 was an outlier in terms of asset correlations we can look at the graphic below:
The last time stocks and bonds moved together in a negative direction was in 1969. At the time, inflation was accelerating and the Fed was hiking interest rates to cool rising costs. In fact, historically, when inflation surges, stocks and bonds have often moved in similar directions. Underscoring this divergence is real interest rate volatility. When real interest rates are a driving force in the market, as we have seen in the last year, it hurts both stock and bond returns. This is because higher interest rates can reduce the future cash flows of these investments. Adding another layer is the level of risk appetite among investors. When the economic outlook is uncertain and interest rate volatility is high, investors are more likely to take risk off their portfolios and demand higher returns for taking on higher risk. This can push down equity and bond prices. On the other hand, if the economic outlook is positive, investors may be willing to take on more risk, in turn potentially boosting equity prices.
Current Investment Returns in Context
Today, financial markets are seeing sharp swings as the ripple effects of higher interest rates are sinking in. For investors, historical data provides insight on long-term asset allocation trends. Over the last century, cycles of high interest rates have come and gone. Both equity and bond investment returns have been resilient for investors who stay the course.