Four Different Styles Used for Trading Stocks
While many investors try to emulate “buy and hold” investors like Warren Buffett, not everyone has the conviction or the patience to wait out positions over years or decades. For active investors in the market, it’s pretty common to see switching in and out of positions – sometimes over the course of months to years, and sometimes on a much more frequent basis.
Trading Stocks: Examining Four Styles
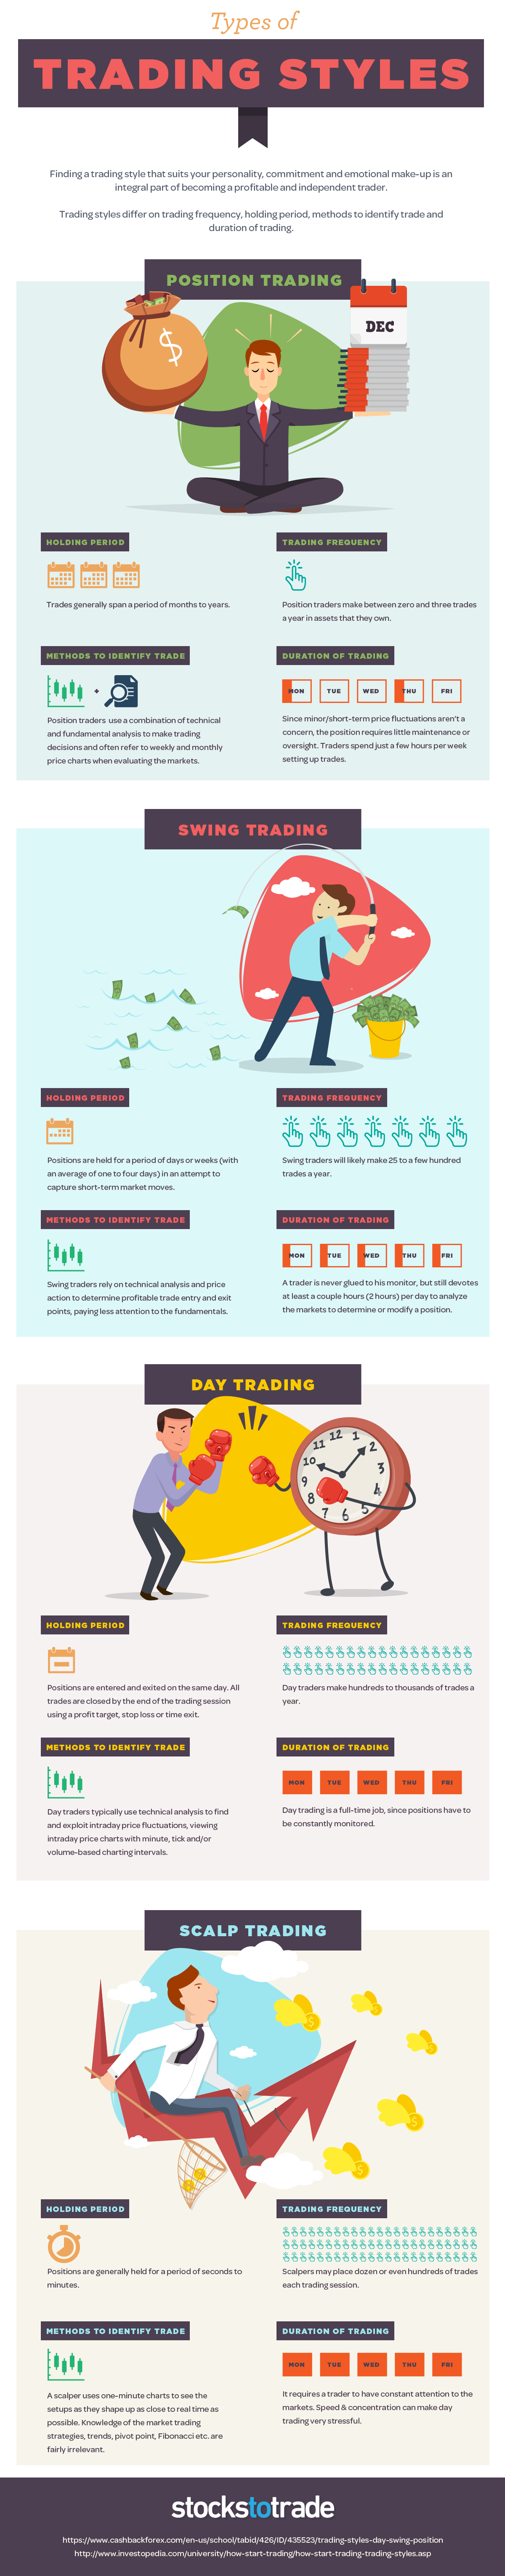
Today’s infographic comes to us from StocksToTrade and it highlights key differences between four trading styles, along with the methods frequently used to identify each trade. The styles range from having holding periods of months or years, all the way down to mere minutes! As these holding timeframes get smaller, the focus typically shifts from evaluating a stock’s fundamentals to gauging short-term technical indicators.
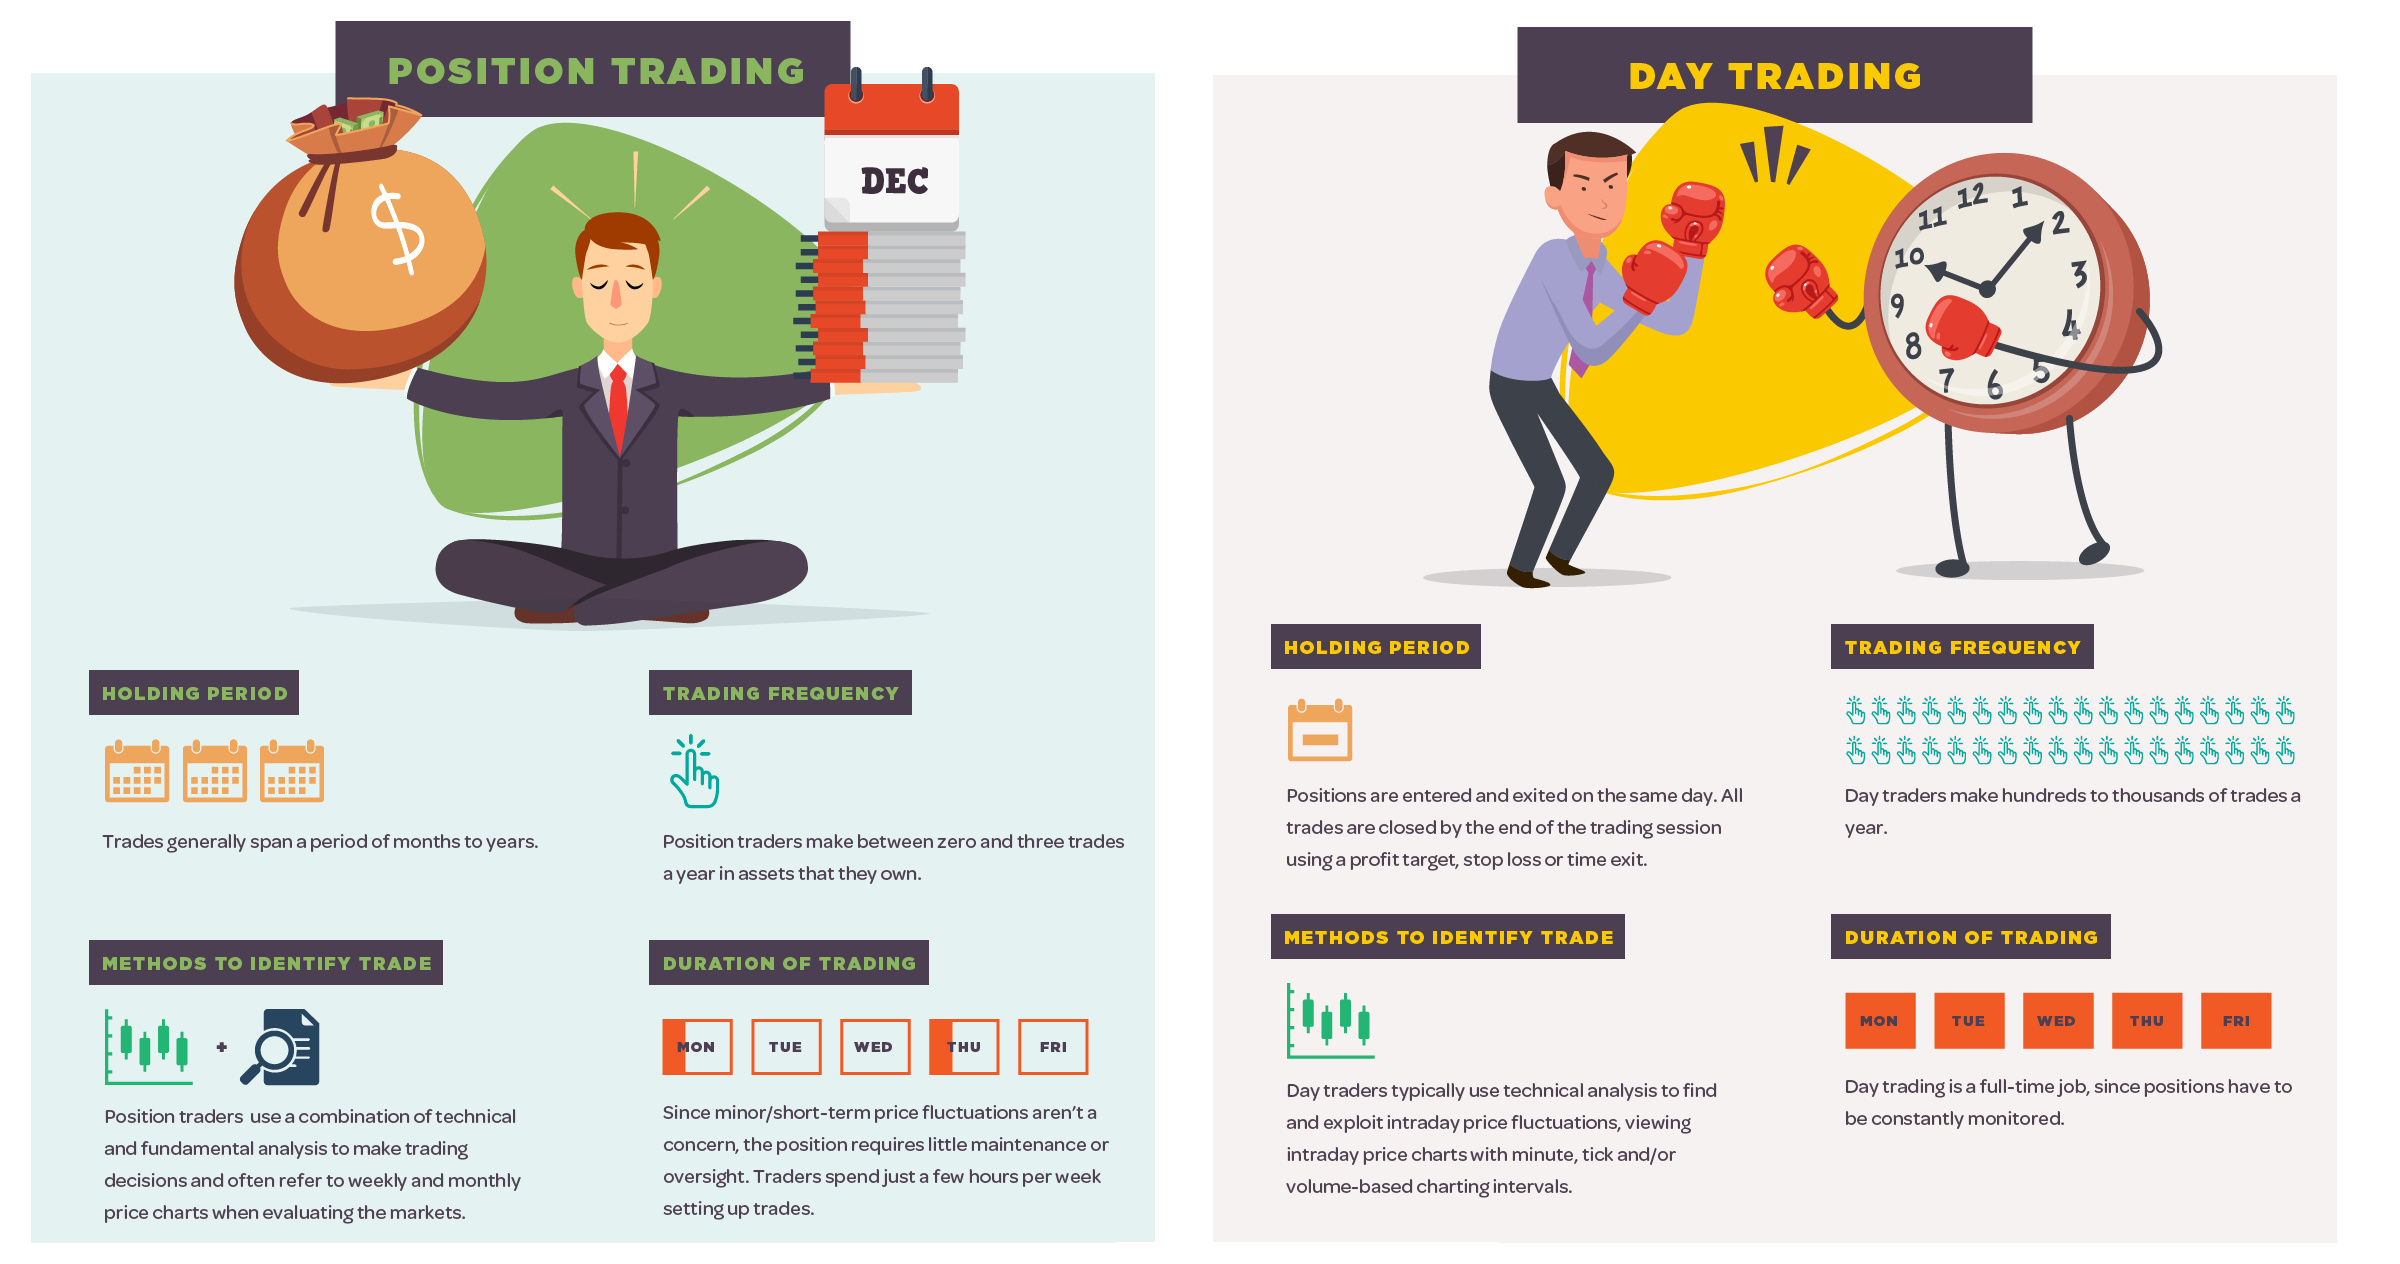
- Position Trading Position traders look closely at a company’s fundamentals in order to accumulate sizable positions that they hold for periods of months or years. This could be done using growth investing or value investing methodologies. Meanwhile, technical analysis can be used to time each individual trade.
- Swing Trading Swing traders go with the flow. They aim to capture the gains of a stock (or options) as they attain short-term momentum in the market. This can be achieved by having a watch list of many interesting stocks, and constantly evaluating technical indicators until an opportunity is spotted.
- Day Trading The notorious day trader is usually glued to his or her computer screen, trading stocks throughout the course of a day. It’s a full-time job not meant for the faint of heart; however, there are people out there who have developed very effective strategies as well as the work ethic to do it strategically.
- Scalp Trading In scalp trading, it can be said that small profits add up. The goal here: to sell every time a profit window appears, and to do so many, many times! This usually involves thousands of trades in a year and access to a live feed and direct-access broker. Scalp trading also requires a strict exit strategy, as any whiff could erase many previous gains.
on Last year, stock and bond returns tumbled after the Federal Reserve hiked interest rates at the fastest speed in 40 years. It was the first time in decades that both asset classes posted negative annual investment returns in tandem. Over four decades, this has happened 2.4% of the time across any 12-month rolling period. To look at how various stock and bond asset allocations have performed over history—and their broader correlations—the above graphic charts their best, worst, and average returns, using data from Vanguard.
How Has Asset Allocation Impacted Returns?
Based on data between 1926 and 2019, the table below looks at the spectrum of market returns of different asset allocations:
We can see that a portfolio made entirely of stocks returned 10.3% on average, the highest across all asset allocations. Of course, this came with wider return variance, hitting an annual low of -43% and a high of 54%.
A traditional 60/40 portfolio—which has lost its luster in recent years as low interest rates have led to lower bond returns—saw an average historical return of 8.8%. As interest rates have climbed in recent years, this may widen its appeal once again as bond returns may rise.
Meanwhile, a 100% bond portfolio averaged 5.3% in annual returns over the period. Bonds typically serve as a hedge against portfolio losses thanks to their typically negative historical correlation to stocks.
A Closer Look at Historical Correlations
To understand how 2022 was an outlier in terms of asset correlations we can look at the graphic below:
The last time stocks and bonds moved together in a negative direction was in 1969. At the time, inflation was accelerating and the Fed was hiking interest rates to cool rising costs. In fact, historically, when inflation surges, stocks and bonds have often moved in similar directions. Underscoring this divergence is real interest rate volatility. When real interest rates are a driving force in the market, as we have seen in the last year, it hurts both stock and bond returns. This is because higher interest rates can reduce the future cash flows of these investments. Adding another layer is the level of risk appetite among investors. When the economic outlook is uncertain and interest rate volatility is high, investors are more likely to take risk off their portfolios and demand higher returns for taking on higher risk. This can push down equity and bond prices. On the other hand, if the economic outlook is positive, investors may be willing to take on more risk, in turn potentially boosting equity prices.
Current Investment Returns in Context
Today, financial markets are seeing sharp swings as the ripple effects of higher interest rates are sinking in. For investors, historical data provides insight on long-term asset allocation trends. Over the last century, cycles of high interest rates have come and gone. Both equity and bond investment returns have been resilient for investors who stay the course.