How the Modern Consumer is Different
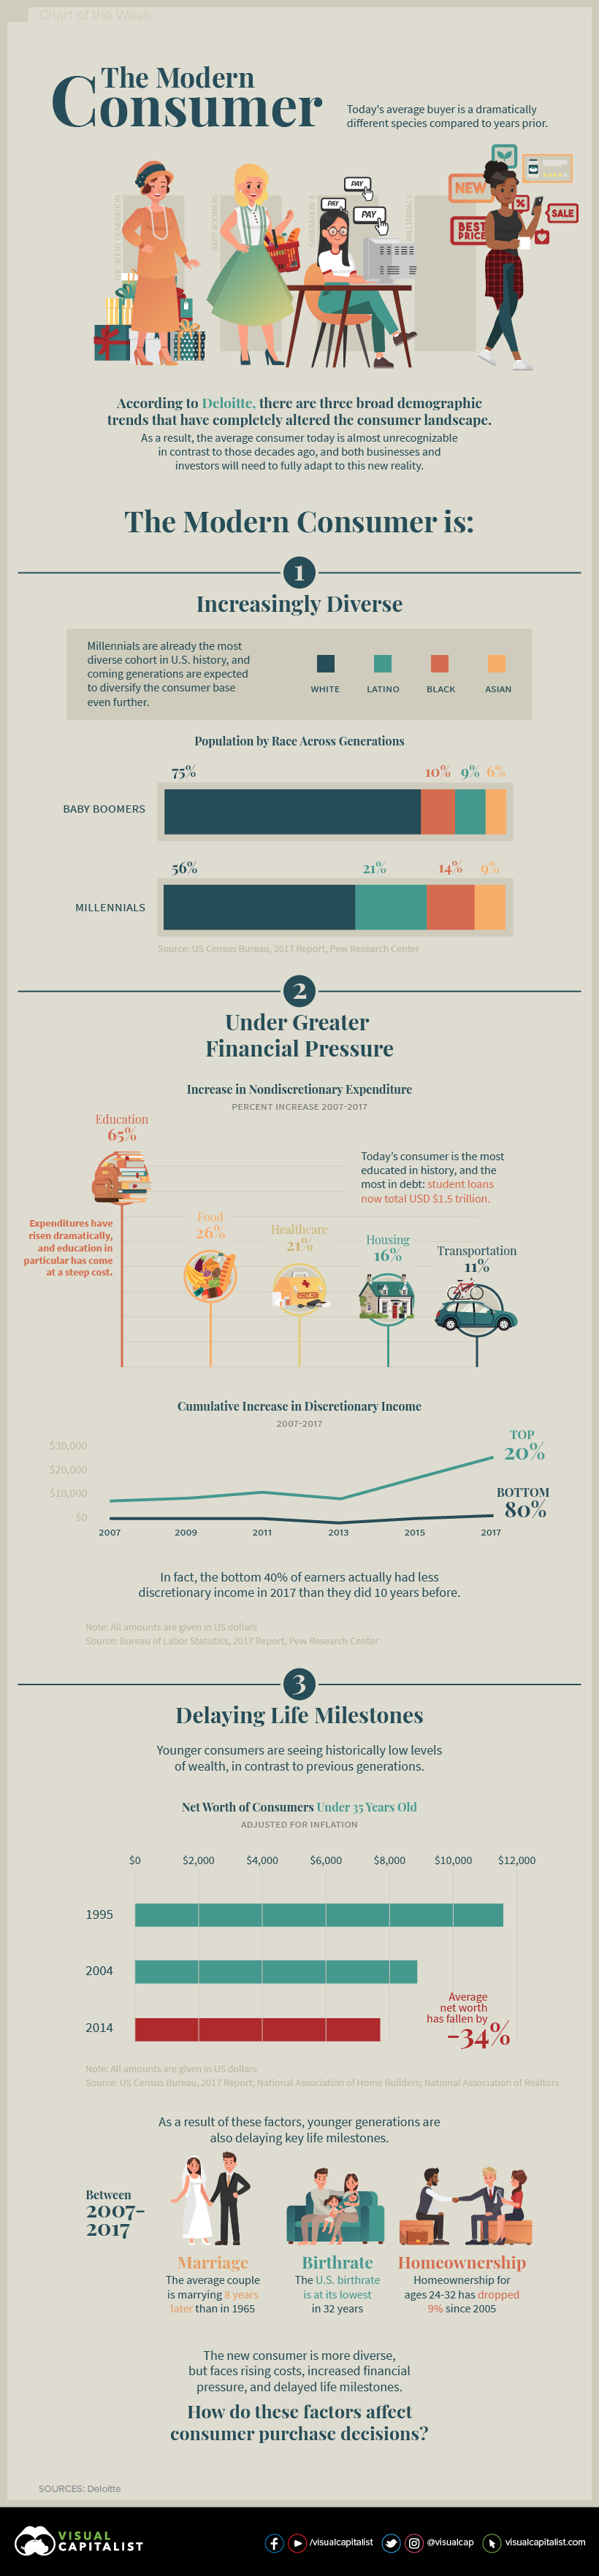
There is a prevailing wisdom that says the stereotypical American consumer can be defined by certain characteristics. Based on what popular culture tells us, as well as years of experiences and data, we all have an idea of what the average consumer might look for in a house, car, restaurant, or shopping center. But as circumstances change, so do consumer tastes – and according to a recent report by Deloitte, the modern consumer is becoming increasingly distinct from those of years past. For us to truly understand how these changes will affect the marketplace and our investments, we need to rethink and update our image of the modern consumer.
A Changing Consumer Base
In their analysis, Deloitte leans heavily on big picture demographic and economic factors to help in summarizing the three major ways in which consumers are changing. Here are three ways the new consumer is different than in years past:
- Increasingly Diverse In terms of ethnicity, the Baby Boomers are 75% white, while the Millennial generation is 56% white. This diversity also transfers to other areas as well, such as sexual and gender identities. Not surprisingly, future generations are expected to be even more heterogeneous – Gen Z, for example, identifies as being 49% non-white.
- Under Greater Financial Pressure Today’s consumers are more educated than ever before, but it’s come at a stiff price. In fact, the cost of education has increased by 65% between 2007 and 2017, and this has translated to a record-setting $1.5 trillion in student loans on the books. Other costs have mounted as well, leaving the bottom 80% of consumers with effectively no increase in discretionary income over the last decade. To make matters worse, if you single out just the bottom 40% of earners, they actually have less discretionary income to spend than they did back in 2007.
- Delaying Key Life Milestones Getting married, having children, and buying a house all have one major thing in common: they can be expensive. The average person under 35 years old has a 34% lower net worth than they would have had in the 1990s, making it harder to tackle typical adult milestones. In fact, the average couple today is marrying eight years later than they did in 1965, while the U.S. birthrate is at its lowest point in three decades. Meanwhile, homeownership for those aged 24-32 has dropped by 9% since 2005.
A New Landscape for Business?
The modern consumer base is more diverse, but also must deal with increased financial pressures and a delayed start in achieving traditional milestones of adulthood. These demographic and economic factors ultimately have a ripple effect down to businesses and investors. How do these big picture changes impact your business or investments? on Today’s chart measures the extent to which 41 major economies are reopening, by plotting two metrics for each country: the mobility rate and the COVID-19 recovery rate: Data for the first measure comes from Google’s COVID-19 Community Mobility Reports, which relies on aggregated, anonymous location history data from individuals. Note that China does not show up in the graphic as the government bans Google services. COVID-19 recovery rates rely on values from CoronaTracker, using aggregated information from multiple global and governmental databases such as WHO and CDC.
Reopening Economies, One Step at a Time
In general, the higher the mobility rate, the more economic activity this signifies. In most cases, mobility rate also correlates with a higher rate of recovered people in the population. Here’s how these countries fare based on the above metrics. Mobility data as of May 21, 2020 (Latest available). COVID-19 case data as of May 29, 2020. In the main scatterplot visualization, we’ve taken things a step further, assigning these countries into four distinct quadrants:
1. High Mobility, High Recovery
High recovery rates are resulting in lifted restrictions for countries in this quadrant, and people are steadily returning to work. New Zealand has earned praise for its early and effective pandemic response, allowing it to curtail the total number of cases. This has resulted in a 98% recovery rate, the highest of all countries. After almost 50 days of lockdown, the government is recommending a flexible four-day work week to boost the economy back up.
2. High Mobility, Low Recovery
Despite low COVID-19 related recoveries, mobility rates of countries in this quadrant remain higher than average. Some countries have loosened lockdown measures, while others did not have strict measures in place to begin with. Brazil is an interesting case study to consider here. After deferring lockdown decisions to state and local levels, the country is now averaging the highest number of daily cases out of any country. On May 28th, for example, the country had 24,151 new cases and 1,067 new deaths.
3. Low Mobility, High Recovery
Countries in this quadrant are playing it safe, and holding off on reopening their economies until the population has fully recovered. Italy, the once-epicenter for the crisis in Europe is understandably wary of cases rising back up to critical levels. As a result, it has opted to keep its activity to a minimum to try and boost the 65% recovery rate, even as it slowly emerges from over 10 weeks of lockdown.
4. Low Mobility, Low Recovery
Last but not least, people in these countries are cautiously remaining indoors as their governments continue to work on crisis response. With a low 0.05% recovery rate, the United Kingdom has no immediate plans to reopen. A two-week lag time in reporting discharged patients from NHS services may also be contributing to this low number. Although new cases are leveling off, the country has the highest coronavirus-caused death toll across Europe. The U.S. also sits in this quadrant with over 1.7 million cases and counting. Recently, some states have opted to ease restrictions on social and business activity, which could potentially result in case numbers climbing back up. Over in Sweden, a controversial herd immunity strategy meant that the country continued business as usual amid the rest of Europe’s heightened regulations. Sweden’s COVID-19 recovery rate sits at only 13.9%, and the country’s -93% mobility rate implies that people have been taking their own precautions.
COVID-19’s Impact on the Future
It’s important to note that a “second wave” of new cases could upend plans to reopen economies. As countries reckon with these competing risks of health and economic activity, there is no clear answer around the right path to take. COVID-19 is a catalyst for an entirely different future, but interestingly, it’s one that has been in the works for a while. —Carmen Reinhart, incoming Chief Economist for the World Bank Will there be any chance of returning to “normal” as we know it?