The world economy has become increasingly connected and interdependent over recent decades, and conventional wisdom suggests that this will only continue in the years ahead. But while it’s tempting to extrapolate the past effects of globalization into the future, such a leap may also be a mistake. That’s because there is growing evidence that globalization itself is quietly transforming – and how it ultimately evolves may be markedly different from what most business leaders might expect.
How Globalization is Changing
Today’s infographic highlights the most recent research about globalization from the McKinsey Global Institute, the business and economics research arm of McKinsey & Company. Below are five major shifts that have gone mostly unnoticed, as well as the countries and companies that could benefit:
The findings of the report show that globalization is not static or constant, and that structural changes in the nature of globalization have been occurring in the background over the last decade or so.
View the Complete Report Here: “Globalization in transition: The future of trade and value chains” The impact that these shifts could have on the global economy is substantial: international trade already adds up to $22.4 trillion each year, or about 28% of global GDP. Even a minor change in this paradigm could affect the list of countries, corporations, and workers that stand to benefit.
The 5 Ways Globalization is Changing
The report looks into 23 different industry value chains in 43 different countries, representing 96% of global trade. From that comprehensive data, five major structural shifts have been identified:
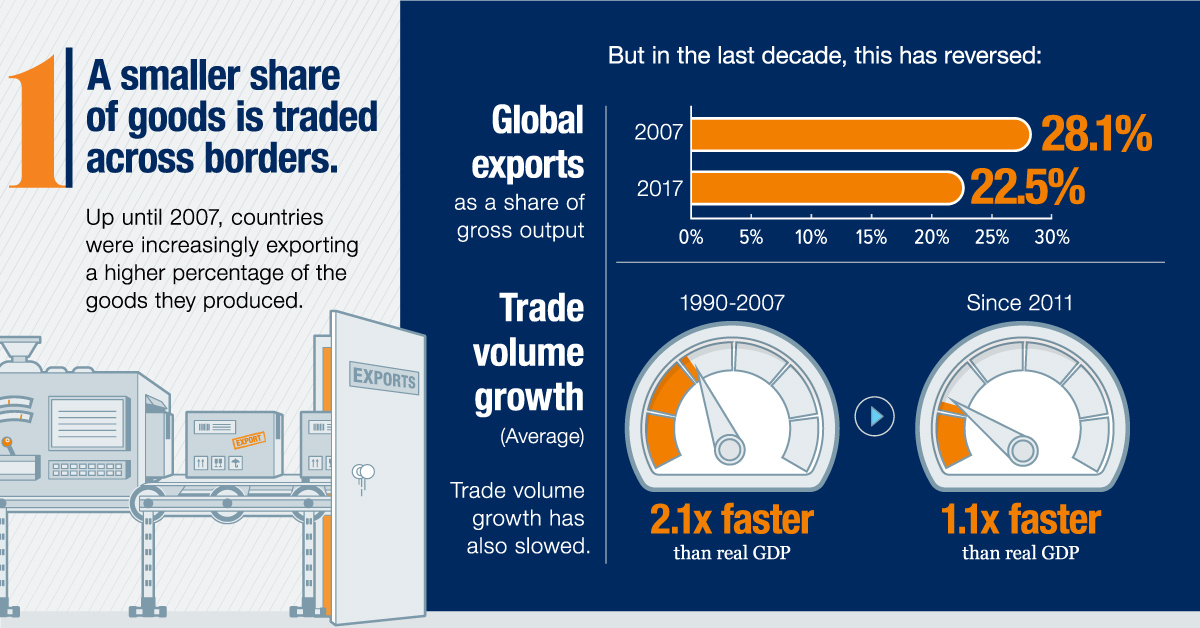
- A smaller share of goods is traded across borders Trade is still growing in absolute terms, but a smaller share of the physical goods made worldwide is now being traded. More specifically, during the span of 2007 to 2017, gross exports as a percentage of gross output decreased from 28.1% to 22.5% globally.
- Services trade is growing 60% faster than goods trade When we think of trade, we often focus on the trade of physical goods (i.e. autos, aerospace, oil). However, services are becoming increasingly important to the global economy – and if accounted for properly, it’s possible that the value of services is closer to $13.4 trillion, which is higher than the total goods trade.
- Labor-cost arbitrage has become less important It’s a common perception that trade flows are driven by companies searching for low-cost labor. However, in value chains today, only 18% of the goods trade is based strictly on labor-cost arbitrage.
- R&D and innovation are becoming increasingly important Companies are spending more on R&D and intangible assets such as brands, software, and IP as a percentage of overall revenue. This spending has increased from 5.4% to 13.1% of revenue over the period of 2000-2017.
- Trade is becoming more concentrated within regions The geography of global demand is changing as emerging markets consume a higher percentage of total goods. Since 2013, intraregional trade has increased by 2.7 percentage points – a reverse from the longstanding trend. – McKinsey Global Institute
Why These Changes Matter
What types of countries are likely to benefit from these shifts, and which will face headwinds? Policy makers and business leaders must understand how the trade landscape is shifting so they can prepare for globalization’s next chapter and the opportunities and challenges it will present. on These are in the form of Treasury securities, some of the most liquid assets worldwide. Central banks use them for foreign exchange reserves and private investors flock to them during flights to safety thanks to their perceived low default risk. Beyond these reasons, foreign investors may buy Treasuries as a store of value. They are often used as collateral during certain international trade transactions, or countries can use them to help manage exchange rate policy. For example, countries may buy Treasuries to protect their currency’s exchange rate from speculation. In the above graphic, we show the foreign holders of the U.S. national debt using data from the U.S. Department of the Treasury.
Top Foreign Holders of U.S. Debt
With $1.1 trillion in Treasury holdings, Japan is the largest foreign holder of U.S. debt. Japan surpassed China as the top holder in 2019 as China shed over $250 billion, or 30% of its holdings in four years. This bond offloading by China is the one way the country can manage the yuan’s exchange rate. This is because if it sells dollars, it can buy the yuan when the currency falls. At the same time, China doesn’t solely use the dollar to manage its currency—it now uses a basket of currencies. Here are the countries that hold the most U.S. debt: As the above table shows, the United Kingdom is the third highest holder, at over $655 billion in Treasuries. Across Europe, 13 countries are notable holders of these securities, the highest in any region, followed by Asia-Pacific at 11 different holders. A handful of small nations own a surprising amount of U.S. debt. With a population of 70,000, the Cayman Islands own a towering amount of Treasury bonds to the tune of $284 billion. There are more hedge funds domiciled in the Cayman Islands per capita than any other nation worldwide. In fact, the four smallest nations in the visualization above—Cayman Islands, Bermuda, Bahamas, and Luxembourg—have a combined population of just 1.2 million people, but own a staggering $741 billion in Treasuries.
Interest Rates and Treasury Market Dynamics
Over 2022, foreign demand for Treasuries sank 6% as higher interest rates and a strong U.S. dollar made owning these bonds less profitable. This is because rising interest rates on U.S. debt makes the present value of their future income payments lower. Meanwhile, their prices also fall. As the chart below shows, this drop in demand is a sharp reversal from 2018-2020, when demand jumped as interest rates hovered at historic lows. A similar trend took place in the decade after the 2008-09 financial crisis when U.S. debt holdings effectively tripled from $2 to $6 trillion.
Driving this trend was China’s rapid purchase of Treasuries, which ballooned from $100 billion in 2002 to a peak of $1.3 trillion in 2013. As the country’s exports and output expanded, it sold yuan and bought dollars to help alleviate exchange rate pressure on its currency. Fast-forward to today, and global interest-rate uncertainty—which in turn can impact national currency valuations and therefore demand for Treasuries—continues to be a factor impacting the future direction of foreign U.S. debt holdings.