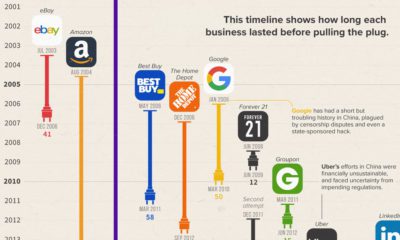
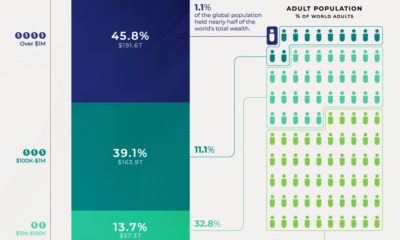
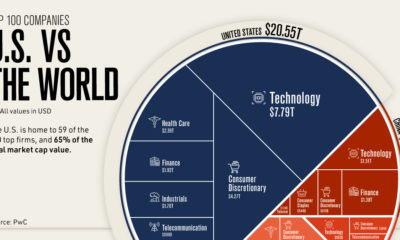
With the aim of tracking market performance around the world, these indexes incorporate securities from various regions. However, while the number of securities may be relatively well diversified across countries, a dollar perspective tells a different story. When market capitalization is taken into account, country weightings may become much more unbalanced. Today’s visualization is based on a concept by S&P Dow Jones Indices that shows the percentage of U.S.-based companies in global sectors and industries as of December 31, 2019. The calculations reflect the market capitalization of companies in the S&P Global Broad Market Index (BMI), an index that tracks over 11,000 stocks across 50 developed and emerging economies.
Percentage of U.S. Companies by Sector
U.S-based companies—those that maintain their primary business affairs in the U.S.—are a major component of many global sectors and industries. Here’s how it breaks down: U.S.-based companies make up a staggering 73% of the information technology (IT) sector. However, China may soon threaten this dominance. The Made in China 2025 plan highlights new-generation IT as a priority sector for the country. —Rebecca Fannin, Journalist & Author of Tech Titans of China Healthcare is also heavily skewed towards U.S-based stocks, which make up 65% of the sector’s market capitalization. This weighting is perhaps not surprising given the success of many U.S. healthcare companies. In Fortune’s list of the 500 most profitable U.S. companies, 41 healthcare organizations made the cut. The materials sector has the smallest weighting of U.S.-based stocks, but they still account for almost one-third of the overall market capitalization. Three American companies are in the sector’s top 10 holdings: Air Products & Chemicals, Ecolab, and Sherwin-Williams.
U.S. Equity Views in a Global Context
Given the high weighting of U.S. stocks in global sectors and industries, having a U.S. view is important. This refers to investors gaining a clear perspective on the risks and opportunities that exist in the country. Investors can consider the trends influencing American companies in order to help explain stock performance. U.S. stock dominance also impacts geographic diversification. While it helps non-U.S. investors overcome their home bias, American investors may want to consider targeting specific international markets for well-rounded exposure. on Last year, stock and bond returns tumbled after the Federal Reserve hiked interest rates at the fastest speed in 40 years. It was the first time in decades that both asset classes posted negative annual investment returns in tandem. Over four decades, this has happened 2.4% of the time across any 12-month rolling period. To look at how various stock and bond asset allocations have performed over history—and their broader correlations—the above graphic charts their best, worst, and average returns, using data from Vanguard.
How Has Asset Allocation Impacted Returns?
Based on data between 1926 and 2019, the table below looks at the spectrum of market returns of different asset allocations:
We can see that a portfolio made entirely of stocks returned 10.3% on average, the highest across all asset allocations. Of course, this came with wider return variance, hitting an annual low of -43% and a high of 54%.
A traditional 60/40 portfolio—which has lost its luster in recent years as low interest rates have led to lower bond returns—saw an average historical return of 8.8%. As interest rates have climbed in recent years, this may widen its appeal once again as bond returns may rise.
Meanwhile, a 100% bond portfolio averaged 5.3% in annual returns over the period. Bonds typically serve as a hedge against portfolio losses thanks to their typically negative historical correlation to stocks.
A Closer Look at Historical Correlations
To understand how 2022 was an outlier in terms of asset correlations we can look at the graphic below:
The last time stocks and bonds moved together in a negative direction was in 1969. At the time, inflation was accelerating and the Fed was hiking interest rates to cool rising costs. In fact, historically, when inflation surges, stocks and bonds have often moved in similar directions. Underscoring this divergence is real interest rate volatility. When real interest rates are a driving force in the market, as we have seen in the last year, it hurts both stock and bond returns. This is because higher interest rates can reduce the future cash flows of these investments. Adding another layer is the level of risk appetite among investors. When the economic outlook is uncertain and interest rate volatility is high, investors are more likely to take risk off their portfolios and demand higher returns for taking on higher risk. This can push down equity and bond prices. On the other hand, if the economic outlook is positive, investors may be willing to take on more risk, in turn potentially boosting equity prices.
Current Investment Returns in Context
Today, financial markets are seeing sharp swings as the ripple effects of higher interest rates are sinking in. For investors, historical data provides insight on long-term asset allocation trends. Over the last century, cycles of high interest rates have come and gone. Both equity and bond investment returns have been resilient for investors who stay the course.