The Origin of the Greek Crisis
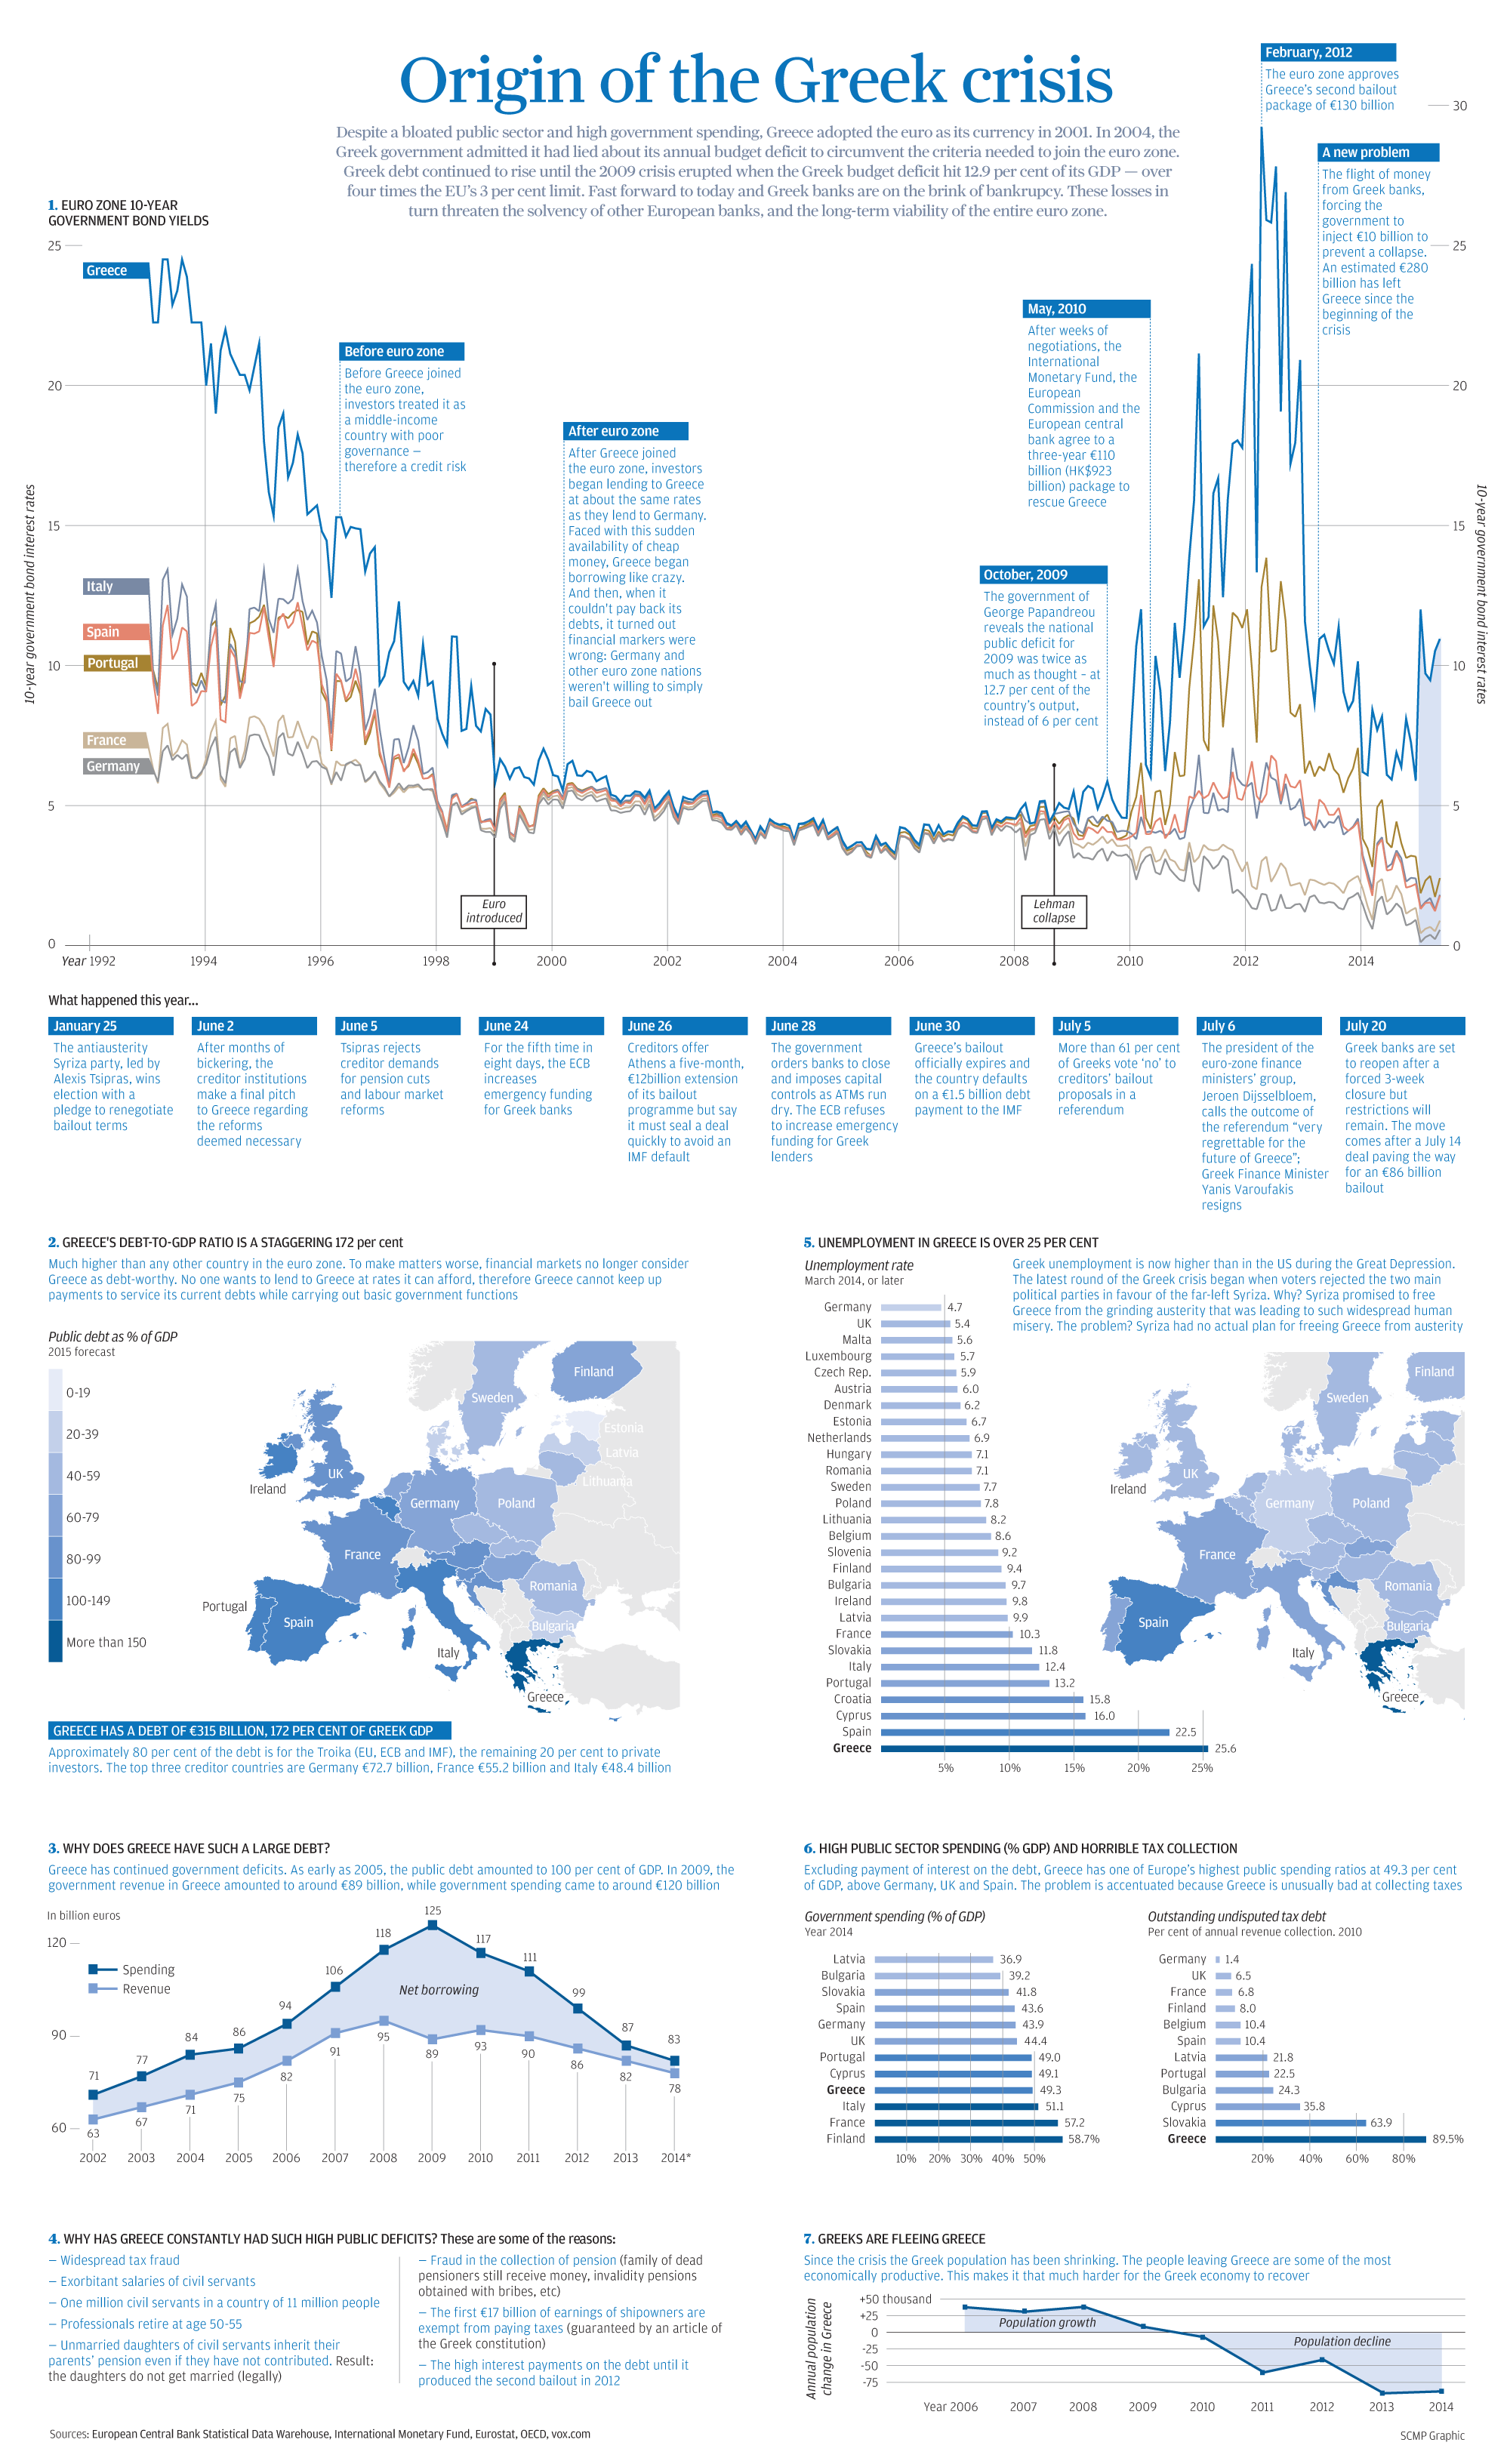
For a larger version of this infographic, click here. In past charts and infographics, we’ve broken down parts of the Greek crisis with a focus on particular issues. For example, the exodus in population or a breakdown of Greece’s debt by creditor. However, today’s infographic puts everything all in one place and recaps the full story from start to near-finish. There is a thorough timeline that shows the events that have led to today in chronological order. The infographic also charts various struggles, ranging from the country’s failure in collecting taxes to the exponential increase in net borrowing after the Lehman collapse. Here’s a quick recap of the most salient facts in the infographic:
In 1994, the Greek 10-yr bond yield was just short of 25%. With plans to join the monetary union, the Greek yield got whittled down over the next five years to converge with the rest of the euro zone at closer to 6%. From 1999 until the Lehman collapse in 2008, Greek bonds traded at par with all other euro zone countries. For almost a decade, investors pegged Greece as having the same amount of risk as Germany or France. The European Debt Crisis begins and bond yields decouple. Greece’s yield skyrockets to closer to 30% in 2012 before the second bailout is approved by the euro zone. Greece’s public sector debt is now at 172%, which is far higher than any other country in the euro zone. We’ve broken down this debt by creditor here. Greek unemployment is higher than in the United States during the Great Depression. Compare Greece’s 25.6% unemployment rate to that of other semi-troubled countries such as Portugal (13.2%) or Italy (12.4%). Greece’s spending increased dramatically over the years from €71 billion (2002) to €125 billion (2009). The only problem? Revenues peaked at only €95 billion in 2008. The difference between spending and revenue is Greece’s net borrowing. The biggest deficit run was in 2009 when revenue was €89 billion and spending was €125 billion. That’s a difference of €36 billion when Greece’s GDP was only €237 billion at the time. Greece’s government spending is not the highest in relation to its GDP. At 49.3%, it trails Italy (51.1%), France (57.2%), and Finland (58.7%). However, Greece’s tax collection is the worst, which severely impairs revenue. In 2010, an astounding 89.5% of annual revenue collection was outstanding undisputed tax debt. Greeks are fleeing the country. Since the crisis the population has been shrinking dramatically. As we noted in our Greek exodus chart, the population decreased by nearly 100,000 people in both 2013 and 2014. Bank deposit flows have also been negative for the most part since 2009 as well.
Original graphic by: SCMP
on Last year, stock and bond returns tumbled after the Federal Reserve hiked interest rates at the fastest speed in 40 years. It was the first time in decades that both asset classes posted negative annual investment returns in tandem. Over four decades, this has happened 2.4% of the time across any 12-month rolling period. To look at how various stock and bond asset allocations have performed over history—and their broader correlations—the above graphic charts their best, worst, and average returns, using data from Vanguard.
How Has Asset Allocation Impacted Returns?
Based on data between 1926 and 2019, the table below looks at the spectrum of market returns of different asset allocations:
We can see that a portfolio made entirely of stocks returned 10.3% on average, the highest across all asset allocations. Of course, this came with wider return variance, hitting an annual low of -43% and a high of 54%.
A traditional 60/40 portfolio—which has lost its luster in recent years as low interest rates have led to lower bond returns—saw an average historical return of 8.8%. As interest rates have climbed in recent years, this may widen its appeal once again as bond returns may rise.
Meanwhile, a 100% bond portfolio averaged 5.3% in annual returns over the period. Bonds typically serve as a hedge against portfolio losses thanks to their typically negative historical correlation to stocks.
A Closer Look at Historical Correlations
To understand how 2022 was an outlier in terms of asset correlations we can look at the graphic below:
The last time stocks and bonds moved together in a negative direction was in 1969. At the time, inflation was accelerating and the Fed was hiking interest rates to cool rising costs. In fact, historically, when inflation surges, stocks and bonds have often moved in similar directions. Underscoring this divergence is real interest rate volatility. When real interest rates are a driving force in the market, as we have seen in the last year, it hurts both stock and bond returns. This is because higher interest rates can reduce the future cash flows of these investments. Adding another layer is the level of risk appetite among investors. When the economic outlook is uncertain and interest rate volatility is high, investors are more likely to take risk off their portfolios and demand higher returns for taking on higher risk. This can push down equity and bond prices. On the other hand, if the economic outlook is positive, investors may be willing to take on more risk, in turn potentially boosting equity prices.
Current Investment Returns in Context
Today, financial markets are seeing sharp swings as the ripple effects of higher interest rates are sinking in. For investors, historical data provides insight on long-term asset allocation trends. Over the last century, cycles of high interest rates have come and gone. Both equity and bond investment returns have been resilient for investors who stay the course.