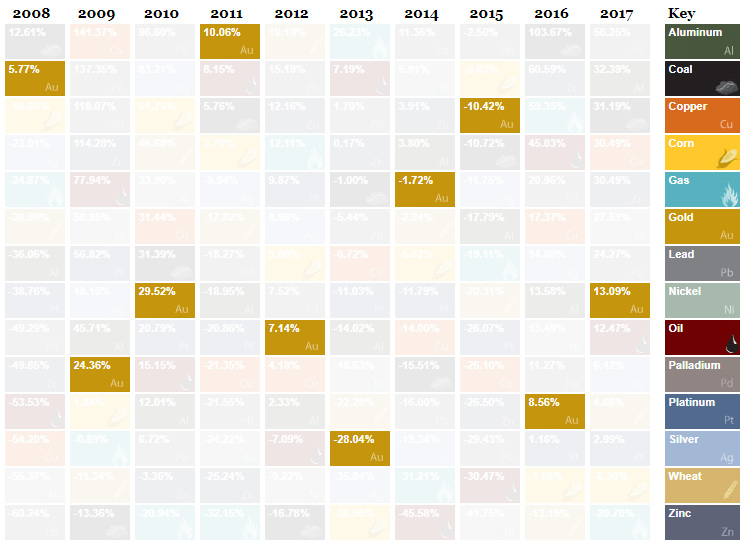
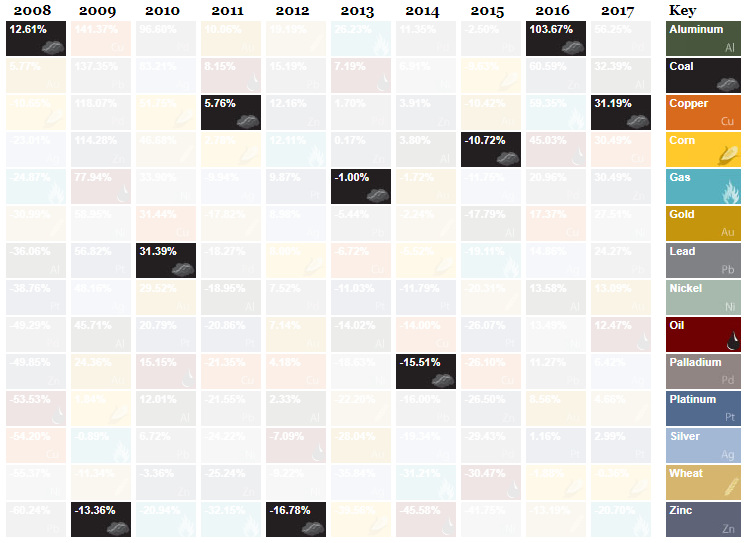
The Periodic Table of Commodity Returns, which comes to us annually from our friends at U.S. Global Investors, shows the returns of commodities over each year of the past decade. As you may have guessed, commodities are a volatile asset class – and as a result, their respective rankings fluctuate wildly each year, making things really interesting for any observer.
The Year in Review
In 2017, we experienced the second full year of recovery from the collapse of commodities that plagued the dreaded stretch from 2011 to 2015. Aside from natural gas (-20.7%), commodities were basically up across the board. The graphic, which focuses mostly on major commodity markets, has palladium (56.3%), aluminum (32.4%), coal (31.2%), copper (30.5%), and zinc (30.5%) as the big winners over the last year. It’s worth mentioning that some smaller markets are not included on the table – and battery metals like cobalt (133%) also did exceptionally well in 2017.
Deeper Digging
If you are not yet thoroughly geeked out, there is an interactive version of this graphic as well. It allows you to sort by category, performance, or volatility. Surprisingly, the least volatile substance on the table is gold:
While the gold market has been eerily quiet as of late, this is unexpected. That’s because, at least compared to other financial assets like bonds or stocks, gold has quite the reputation for being volatile and risky. But, when compared to other commodities, gold actually appears relatively tame.
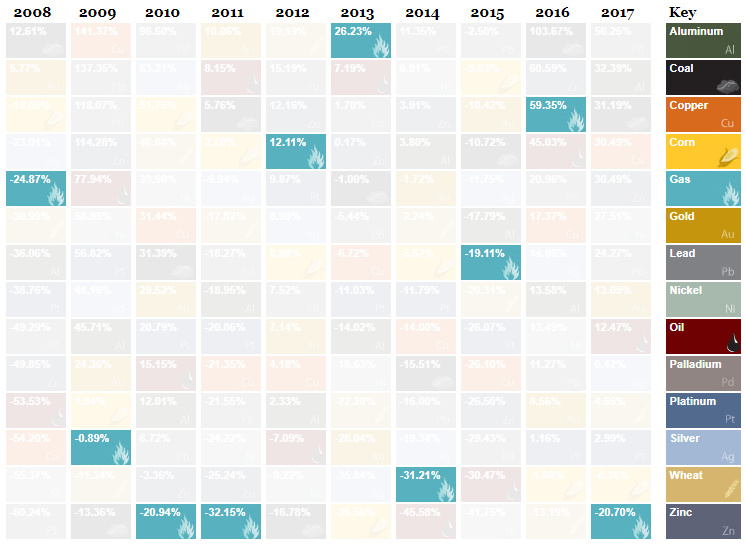
What Real Volatility Looks Like
Here are the charts for natural gas and coal, each which much better represent a Dr. Jekyll / Mr. Hyde relationship.
Natural gas is in weird place. It’s a better alternative than coal or oil for emissions, but it’s still a fossil fuel. This, along with the natural ebbs and flows of the oil and gas markets, have made gas particularly volatile over the last few years.
Of course, coal is falling out of favor in the long-term global energy mix – but that doesn’t mean it can’t get a shot in the arm from Chinese or Indian demand in the short term. As a result, coal is all over the map on the Periodic Table of Commodity Returns, as well. on Last year, stock and bond returns tumbled after the Federal Reserve hiked interest rates at the fastest speed in 40 years. It was the first time in decades that both asset classes posted negative annual investment returns in tandem. Over four decades, this has happened 2.4% of the time across any 12-month rolling period. To look at how various stock and bond asset allocations have performed over history—and their broader correlations—the above graphic charts their best, worst, and average returns, using data from Vanguard.
How Has Asset Allocation Impacted Returns?
Based on data between 1926 and 2019, the table below looks at the spectrum of market returns of different asset allocations:
We can see that a portfolio made entirely of stocks returned 10.3% on average, the highest across all asset allocations. Of course, this came with wider return variance, hitting an annual low of -43% and a high of 54%.
A traditional 60/40 portfolio—which has lost its luster in recent years as low interest rates have led to lower bond returns—saw an average historical return of 8.8%. As interest rates have climbed in recent years, this may widen its appeal once again as bond returns may rise.
Meanwhile, a 100% bond portfolio averaged 5.3% in annual returns over the period. Bonds typically serve as a hedge against portfolio losses thanks to their typically negative historical correlation to stocks.
A Closer Look at Historical Correlations
To understand how 2022 was an outlier in terms of asset correlations we can look at the graphic below:
The last time stocks and bonds moved together in a negative direction was in 1969. At the time, inflation was accelerating and the Fed was hiking interest rates to cool rising costs. In fact, historically, when inflation surges, stocks and bonds have often moved in similar directions. Underscoring this divergence is real interest rate volatility. When real interest rates are a driving force in the market, as we have seen in the last year, it hurts both stock and bond returns. This is because higher interest rates can reduce the future cash flows of these investments. Adding another layer is the level of risk appetite among investors. When the economic outlook is uncertain and interest rate volatility is high, investors are more likely to take risk off their portfolios and demand higher returns for taking on higher risk. This can push down equity and bond prices. On the other hand, if the economic outlook is positive, investors may be willing to take on more risk, in turn potentially boosting equity prices.
Current Investment Returns in Context
Today, financial markets are seeing sharp swings as the ripple effects of higher interest rates are sinking in. For investors, historical data provides insight on long-term asset allocation trends. Over the last century, cycles of high interest rates have come and gone. Both equity and bond investment returns have been resilient for investors who stay the course.


title: “Infographic The Periodic Table Of Commodity Returns” ShowToc: true date: “2023-01-29” author: “Ethel Cardella”
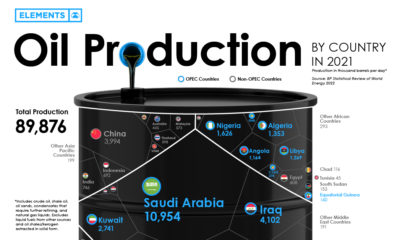
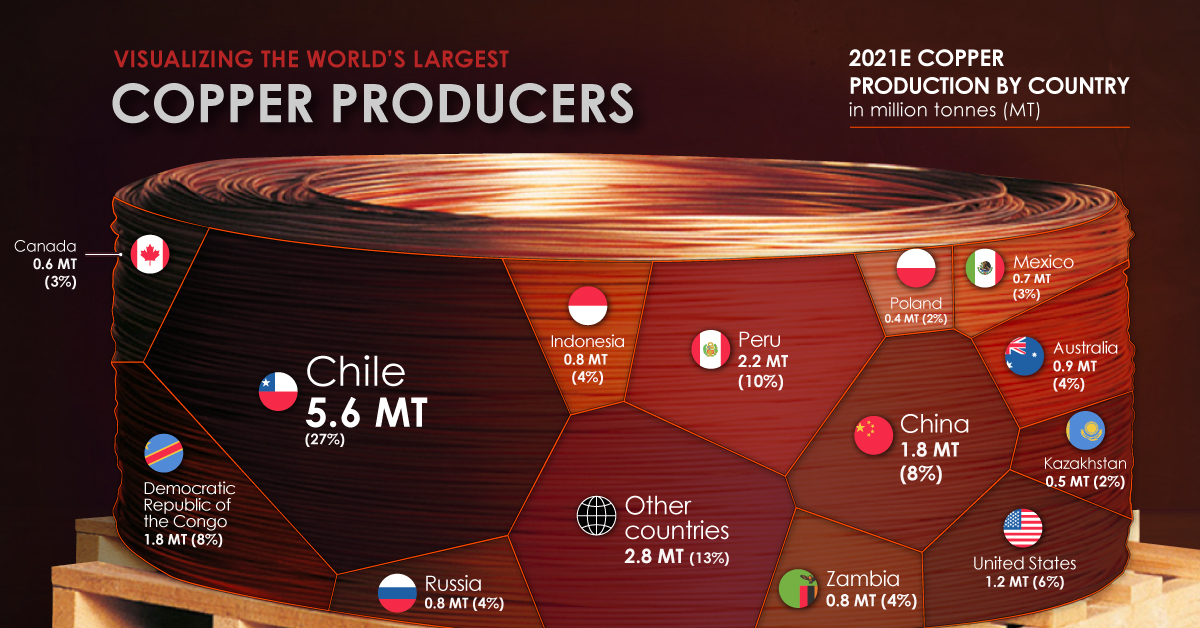
For those keeping score, 2015 was a historically bad year for commodities in almost every regard. Base Metals: The fact that lead was the best performing commodity with -3.5% returns throughout 2015 is not a good sign. However, compared to its fellow base metals such as copper (-26.1%), zinc (-26.5%), aluminum (-17.8%), and nickel (-41.8%), lead did wonderfully in comparison. Precious Metals: Gold held in there as a relative top-performer with only a -10.4% dip. That said, it’s started off 2016 with a nice rally so far. Silver, platinum, and palladium did worse in 2015, all returning -11.8%, -26.1%, and -29.4% respectively. Energy: The worst performing commodity of 2014 was the second-worst performing commodity of 2015. Oil was been routed in the last two years, with -45.6% and -30.5% returns respectively. Other fossil fuels have followed, with natural gas (-19.1%) and coal (-10.8%) both losing ground in 2015 as well. Food: Corn was among the “best” performers, returning -9.6%. Wheat struggled more throughout 2015, returning -20.3%. Deflating commodity prices also compounded with a strengthening dollar to hit currency markets hard, allowing Bitcoin to become the best performing currency of 2015 by far. Countries heavily reliant on commodity exports such as Canada, Brazil, Russia, Mexico, Australia, Norway, and South Africa had their currencies hammered in relation to the U.S. dollar. on Man has relied on copper since prehistoric times. It is a major industrial metal with many applications due to its high ductility, malleability, and electrical conductivity. Many new technologies critical to fighting climate change, like solar panels and wind turbines, rely on the red metal. But where does the copper we use come from? Using the U.S. Geological Survey’s data, the above infographic lists the world’s largest copper producing countries in 2021.
The Countries Producing the World’s Copper
Many everyday products depend on minerals, including mobile phones, laptops, homes, and automobiles. Incredibly, every American requires 12 pounds of copper each year to maintain their standard of living. North, South, and Central America dominate copper production, as these regions collectively host 15 of the 20 largest copper mines. Chile is the top copper producer in the world, with 27% of global copper production. In addition, the country is home to the two largest mines in the world, Escondida and Collahuasi. Chile is followed by another South American country, Peru, responsible for 10% of global production. The Democratic Republic of Congo (DRC) and China share third place, with 8% of global production each. Along with being a top producer, China also consumes 54% of the world’s refined copper.
Copper’s Role in the Green Economy
Technologies critical to the energy transition, such as EVs, batteries, solar panels, and wind turbines require much more copper than conventional fossil fuel based counterparts. For example, copper usage in EVs is up to four times more than in conventional cars. According to the Copper Alliance, renewable energy systems can require up to 12x more copper compared to traditional energy systems. With these technologies’ rapid and large-scale deployment, copper demand from the energy transition is expected to increase by nearly 600% by 2030. As the transition to renewable energy and electrification speeds up, so will the pressure for more copper mines to come online.