Silver Series Part 3: The World’s Growing Demand For Silver
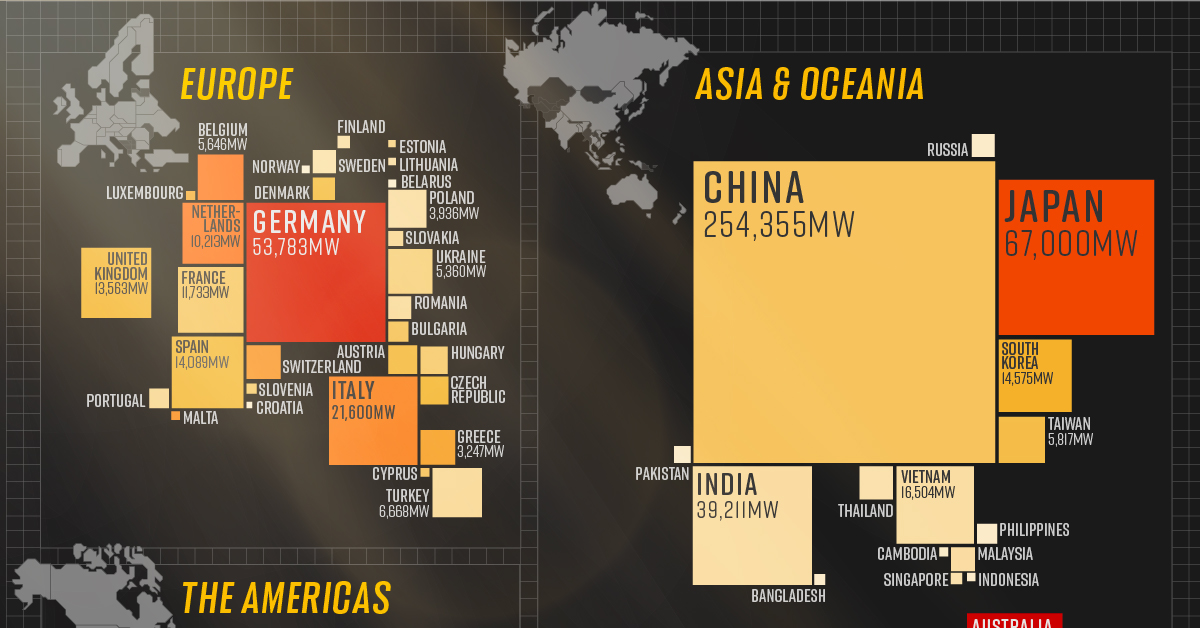
Silver is the most versatile metal in the world. Not only does it have the highest thermal and electrical conductivity of all metals, but it also has many other impressive properties: silver is antibacterial, durable, reflective, and malleable. With such a multitude of significant material qualities, it is no surprise that now more than half of silver used today is in industrial processes. Last year, it is estimated that 53% of silver was used in industry – an increase from a total of 46% a decade ago. Industry Perhaps the most notable industrial sector for silver demand is photovoltaics, where 2.8 million oz of silver is used for every gigawatt of solar energy capacity. The total installed capacity of solar globally is at around 178 GW in 2014, and growth in global installs is also significant, gaining 14% between 2013 and 2014. The metal’s other main industrial uses include brazing and soldering as well as fabrication. In the former category, using silver for brazing and soldering helps produce leak-tight and corrosion-resistant joints when combining metal parts. In terms of fabrication, silver-containing vehicles, batteries, and chemical processes are the most important categories for future growth. For use in automotive manufacturing, which has the highest project growth (4.9% CAGR) of categories other than solar, silver is used to coat electrical contacts to ensure the most efficient energy flow. Silver batteries, which have similar energy densities to lithium-ion batteries, are used in military and aerospace applications because they are more reliable and safe. Lastly, silver catalysts are also used to help combine ethylene and oxygen together to create ethylene oxide, which is used in medicine, anti-freeze, and cosmetics. Investment While industrial uses are the most prominent for the metal, it is investment that has been the real growth engine for silver demand over the last decade. In 2014, 20% of all silver is used for investment purposes, compared to only 7% a decade ago. The demand for silver coins and bars has more than quadrupled since the early 2000s, and the coin sales of Canadian Maple Leafs and American Eagles have been soaring for years. It is also interesting to note, especially at a time of such market vulnerability, that the ratio of silver to gold ounces bought in the market increases. This ratio peaked recently during the Global Financial Crisis in 2008, and in the last 12 months it has jumped up to comparable levels. Jewelry Jewelry is also a crucial market for silver, and the category is considered by some to serve as an investment and store of wealth as well. Lower prices for silver in recent years have helped jewelry rebound in Asia and the United States in particular. Globally, silver jewelry fabrication experienced its second year of consecutive growth, increasing 1.5% to achieve a new record high. This was a reflection chiefly of the strong performance of silver jewelry demand from India, which surged 47% from 2013 levels. A record of 7,063 tonnes of silver were imported to India in 2014, up 15% from 2013. The country imported more silver in November 2014 than they did in all of 2009. This is partially due to India’s rising population and per capital income, and also due to import restrictions on gold in the world’s second most populous country. Conclusion Silver demand is multi-faceted, with just over half of demand coming from industry and the rest split between mainly investment and jewelry demand. We will cover the historical returns of investing in silver in-depth with our final part of the Silver Series in the coming weeks. Don’t miss out on the last part of the Silver Series by connecting with Visual Capitalist. on The world is adopting renewable energy at an unprecedented pace, and solar power is the energy source leading the way. Despite a 4.5% fall in global energy demand in 2020, renewable energy technologies showed promising progress. While the growth in renewables was strong across the board, solar power led from the front with 127 gigawatts installed in 2020, its largest-ever annual capacity expansion. The above infographic uses data from the International Renewable Energy Agency (IRENA) to map solar power capacity by country in 2021. This includes both solar photovoltaic (PV) and concentrated solar power capacity.
The Solar Power Leaderboard
From the Americas to Oceania, countries in virtually every continent (except Antarctica) added more solar to their mix last year. Here’s a snapshot of solar power capacity by country at the beginning of 2021: *1 megawatt = 1,000,000 watts. China is the undisputed leader in solar installations, with over 35% of global capacity. What’s more, the country is showing no signs of slowing down. It has the world’s largest wind and solar project in the pipeline, which could add another 400,000MW to its clean energy capacity. Following China from afar is the U.S., which recently surpassed 100,000MW of solar power capacity after installing another 50,000MW in the first three months of 2021. Annual solar growth in the U.S. has averaged an impressive 42% over the last decade. Policies like the solar investment tax credit, which offers a 26% tax credit on residential and commercial solar systems, have helped propel the industry forward. Although Australia hosts a fraction of China’s solar capacity, it tops the per capita rankings due to its relatively low population of 26 million people. The Australian continent receives the highest amount of solar radiation of any continent, and over 30% of Australian households now have rooftop solar PV systems.
China: The Solar Champion
In 2020, President Xi Jinping stated that China aims to be carbon neutral by 2060, and the country is taking steps to get there. China is a leader in the solar industry, and it seems to have cracked the code for the entire solar supply chain. In 2019, Chinese firms produced 66% of the world’s polysilicon, the initial building block of silicon-based photovoltaic (PV) panels. Furthermore, more than three-quarters of solar cells came from China, along with 72% of the world’s PV panels. With that said, it’s no surprise that 5 of the world’s 10 largest solar parks are in China, and it will likely continue to build more as it transitions to carbon neutrality.
What’s Driving the Rush for Solar Power?
The energy transition is a major factor in the rise of renewables, but solar’s growth is partly due to how cheap it has become over time. Solar energy costs have fallen exponentially over the last decade, and it’s now the cheapest source of new energy generation. Since 2010, the cost of solar power has seen a 85% decrease, down from $0.28 to $0.04 per kWh. According to MIT researchers, economies of scale have been the single-largest factor in continuing the cost decline for the last decade. In other words, as the world installed and made more solar panels, production became cheaper and more efficient. This year, solar costs are rising due to supply chain issues, but the rise is likely to be temporary as bottlenecks resolve.