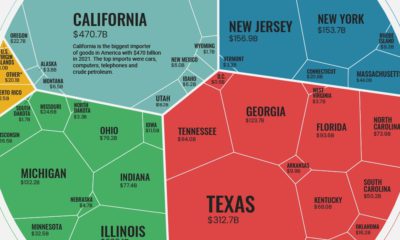
From Rotterdam to Singapore, we see tangible evidence of the world’s bustling maritime shipping network as cranes load and unload uniform containers in a flurry of activity. The efficiency of this system has massively impacted the global economy, but this uniformity has also had the unintended consequence of anonymizing shipping. From the outside looking in, there’s no indication of who’s actually doing the shipping. Today’s graphic, using data from JOC, highlights the actual companies behind the United States’ import–export numbers.
Outgoing: Recyclables and Raw Materials
While companies like Procter & Gamble and Caterpillar export a high volume of consumer goods and equipment, the export market is dominated by bulk materials, natural resources, and chemicals. Here are the top 20 companies by export volume (20-foot equivalent units, or TEUs):
Though exporters of recyclable materials feature prominently on this list, there may be a shake-up coming in the near future.
China’s Recycling Diet
In Western countries, people often assume that their top export by volume is a high-value manufactured good or, at very least, a natural resource like timber or oil. The truth is, a sizable portion of exports from Western countries are waste materials. This isn’t a new trend. In 2009, nine of the top 20 exporters in the U.S. were sending recyclable materials overseas – particularly to China. This convenient trade relationship, where ships bring consumer goods to America and return filled with recyclable materials, is being disrupted in a big way. In 2018, China launched Operation National Sword, which could potentially tie a knot in the steady pipeline of waste materials being imported into the country. For now, countries like Vietnam and Thailand have picked up some of the slack, but before long, Western countries will need to take a serious look at beefing up domestic recycling programs.
Incoming: The Stuff We Buy
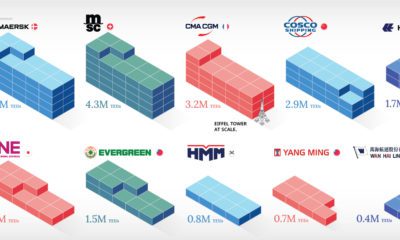
On the other end of the equation are the consumer goods that get purchased every day. In modern society, there’s a very good chance the items around you right now were not built in the country you live in. While many companies import goods from overseas, a few major players move a staggering volume of goods through America’s ports. Here are the top 20 companies by import volume (TEUs): In contrast to the top exporters list, the top importing companies are generally more recognizable names, such as Target, Home Depot, Dollar Tree, and Ikea. It will come as no surprise that Walmart, the world’s biggest retailer by some margin, is also America’s top importer. In a single year, Walmart’s incoming goods would equate to nearly 50 of the industry’s largest fully-loaded cargo ships. on Both figures surpassed analyst expectations by a wide margin, and in January, the unemployment rate hit a 53-year low of 3.4%. With the recent release of February’s numbers, unemployment is now reported at a slightly higher 3.6%. A low unemployment rate is a classic sign of a strong economy. However, as this visualization shows, unemployment often reaches a cyclical low point right before a recession materializes.
Reasons for the Trend
In an interview regarding the January jobs data, U.S. Treasury Secretary Janet Yellen made a bold statement: While there’s nothing wrong with this assessment, the trend we’ve highlighted suggests that Yellen may need to backtrack in the near future. So why do recessions tend to begin after unemployment bottoms out?
The Economic Cycle
The economic cycle refers to the economy’s natural tendency to fluctuate between periods of growth and recession. This can be thought of similarly to the four seasons in a year. An economy expands (spring), reaches a peak (summer), begins to contract (fall), then hits a trough (winter). With this in mind, it’s reasonable to assume that a cyclical low in the unemployment rate (peak employment) is simply a sign that the economy has reached a high point.
Monetary Policy
During periods of low unemployment, employers may have a harder time finding workers. This forces them to offer higher wages, which can contribute to inflation. For context, consider the labor shortage that emerged following the COVID-19 pandemic. We can see that U.S. wage growth (represented by a three-month moving average) has climbed substantially, and has held above 6% since March 2022. The Federal Reserve, whose mandate is to ensure price stability, will take measures to prevent inflation from climbing too far. In practice, this involves raising interest rates, which makes borrowing more expensive and dampens economic activity. Companies are less likely to expand, reducing investment and cutting jobs. Consumers, on the other hand, reduce the amount of large purchases they make. Because of these reactions, some believe that aggressive rate hikes by the Fed can either cause a recession, or make them worse. This is supported by recent research, which found that since 1950, central banks have been unable to slow inflation without a recession occurring shortly after.
Politicians Clash With Economists
The Fed has raised interest rates at an unprecedented pace since March 2022 to combat high inflation. More recently, Fed Chairman Jerome Powell warned that interest rates could be raised even higher than originally expected if inflation continues above target. Senator Elizabeth Warren expressed concern that this would cost Americans their jobs, and ultimately, cause a recession. Powell remains committed to bringing down inflation, but with the recent failures of Silicon Valley Bank and Signature Bank, some analysts believe there could be a pause coming in interest rate hikes. Editor’s note: just after publication of this article, it was confirmed that U.S. interest rates were hiked by 25 basis points (bps) by the Federal Reserve.