But despite nearly historic debt levels, it does not seem that the national debt is a key issue for most citizens and groups. What drives this accumulation of debt in the long run, and at what point does the debt level become so high that it becomes an undeniable and critical issue for the country? Today’s infographic comes from the Peter G. Peterson Foundation, a NYC-based group that focuses on educating people about the fiscal challenges of growing government debt. The graphic illustrates the main factors driving the debt upwards, as well as the potential impact down the road.
Rising Temperatures
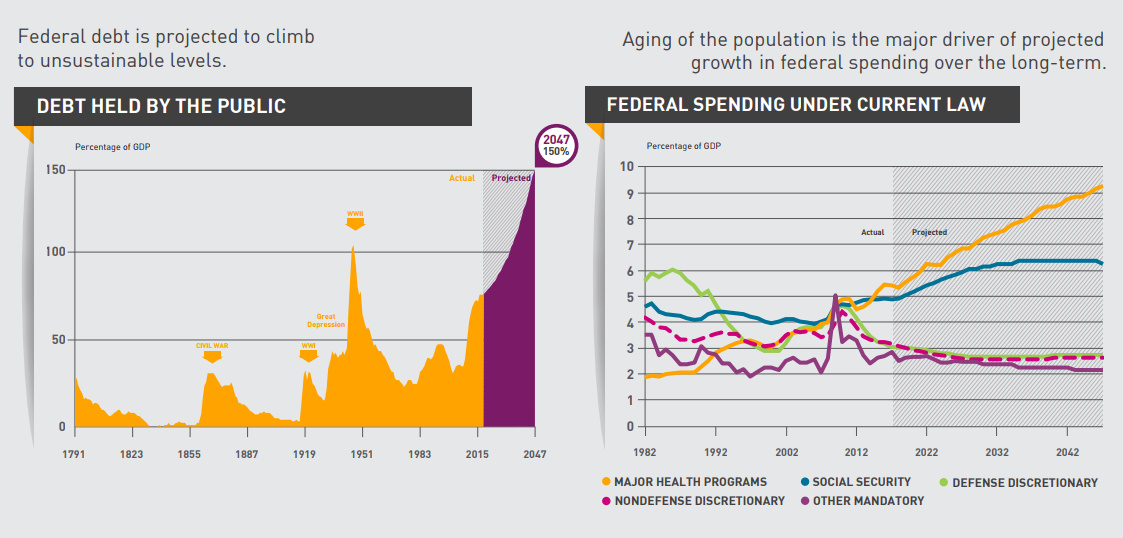
The trouble with debt is that it delays today’s challenges well into the future, making it a tempting short-term solution when other things aren’t working. However, over time, that burden increases steadily, and the situation quickly represents the “frog and boiling water” parable. So what’s raising the temperature of that water? Right now, the aging of the Baby Boomers is a key factor, and the amount of people receiving social security benefits will swell from 62 million to 88 million people by 2035. At the same time, Medicare’s hospital trust fund will run out of money by 2029, and the program will only remain solvent until 2034. Whether it’s the growing enrollment in these programs or the rapidly escalating costs of healthcare itself, more money will be put towards Social Security and healthcare over the coming years. By about 2045, government spending on major health programs will nearly double in size to greater than 9% of GDP.
Boiling Water
Today, interest on the debt is equal to about 1.4% of GDP. However, if the projected pace is maintained, it’s anticipated that interest payments could be equal to 6.2% of GDP by 2047 – this is roughly 2x the average annual amount the federal government spends on education, infrastructure, and R&D combined. As economists will point out, the government controls the monetary supply and can easily “print” money to make these payments. This is absolutely true, but it also creates an array of other problems such as inflation and increasing distrust in the monetary system. Though this boiling point looms further down the road, having a plan to cool the temperature (or to jump out of the water) could be a prudent one to keep in our back pockets. on These are in the form of Treasury securities, some of the most liquid assets worldwide. Central banks use them for foreign exchange reserves and private investors flock to them during flights to safety thanks to their perceived low default risk. Beyond these reasons, foreign investors may buy Treasuries as a store of value. They are often used as collateral during certain international trade transactions, or countries can use them to help manage exchange rate policy. For example, countries may buy Treasuries to protect their currency’s exchange rate from speculation. In the above graphic, we show the foreign holders of the U.S. national debt using data from the U.S. Department of the Treasury.
Top Foreign Holders of U.S. Debt
With $1.1 trillion in Treasury holdings, Japan is the largest foreign holder of U.S. debt. Japan surpassed China as the top holder in 2019 as China shed over $250 billion, or 30% of its holdings in four years. This bond offloading by China is the one way the country can manage the yuan’s exchange rate. This is because if it sells dollars, it can buy the yuan when the currency falls. At the same time, China doesn’t solely use the dollar to manage its currency—it now uses a basket of currencies. Here are the countries that hold the most U.S. debt: As the above table shows, the United Kingdom is the third highest holder, at over $655 billion in Treasuries. Across Europe, 13 countries are notable holders of these securities, the highest in any region, followed by Asia-Pacific at 11 different holders. A handful of small nations own a surprising amount of U.S. debt. With a population of 70,000, the Cayman Islands own a towering amount of Treasury bonds to the tune of $284 billion. There are more hedge funds domiciled in the Cayman Islands per capita than any other nation worldwide. In fact, the four smallest nations in the visualization above—Cayman Islands, Bermuda, Bahamas, and Luxembourg—have a combined population of just 1.2 million people, but own a staggering $741 billion in Treasuries.
Interest Rates and Treasury Market Dynamics
Over 2022, foreign demand for Treasuries sank 6% as higher interest rates and a strong U.S. dollar made owning these bonds less profitable. This is because rising interest rates on U.S. debt makes the present value of their future income payments lower. Meanwhile, their prices also fall. As the chart below shows, this drop in demand is a sharp reversal from 2018-2020, when demand jumped as interest rates hovered at historic lows. A similar trend took place in the decade after the 2008-09 financial crisis when U.S. debt holdings effectively tripled from $2 to $6 trillion.
Driving this trend was China’s rapid purchase of Treasuries, which ballooned from $100 billion in 2002 to a peak of $1.3 trillion in 2013. As the country’s exports and output expanded, it sold yuan and bought dollars to help alleviate exchange rate pressure on its currency. Fast-forward to today, and global interest-rate uncertainty—which in turn can impact national currency valuations and therefore demand for Treasuries—continues to be a factor impacting the future direction of foreign U.S. debt holdings.