From the gasoline in our cars to the plastic in countless everyday items, crude oil is an essential raw material that shows up everywhere in our lives. With around 18 million barrels of crude oil consumed every day just in America, this commodity powers transport, utilities, and is a vital ingredient in many of the things we use on a daily basis. This graphic visualizes how much crude oil is refined into various finished products, using a barrel of oil to represent the proportional breakdown.
Barrel of Oil to Functional Fuel and More
Crude oil is primarily refined into various types of fuels to power transport and vital utilities. More than 85% of crude oil is refined into fuels like gasoline, diesel, and hydrocarbon gas liquids (HGLs) like propane and butane. Along with being fuels for transportation, heating, and cooking, HGLs are used as feedstock for the production of chemicals, plastics, and synthetic rubber, and as additives for motor gasoline production. Source: Canadian Association of Petroleum Producers Crude oil not only powers our vehicles, but it also helps pave the roads we drive on. About 4% of refined crude oil becomes asphalt, which is used to make concrete and different kinds of sealing and insulation products. Although transportation and utility fuels dominate a large proportion of refined products, essential everyday materials like wax and plastic are also dependent on crude oil. With about 10% of refined products used to make plastics, cosmetics, and textiles, a barrel of crude oil can produce a variety of unexpected everyday products. Personal care products like cosmetics and shampoo are made using petroleum products, as are medical supplies like IV bags and pharmaceuticals. Modern life would look very different without crude oil.
The Process of Refining Crude Oil
You might have noticed that while a barrel of oil contains 42 gallons, it ends up producing 45 gallons of refined products. This is because the majority of refined products have a lower density than crude oil, resulting in an increase in volume that is called processing gain. Along with this, there are other inputs aside from crude oil that are used in the refining process. While crude oil is the primary input, fuel ethanol, hydrocarbon gas liquids, and other blending liquids are also used. Source: EIA The process of refining a 30,000-barrel batch of crude oil typically takes between 12-24 hours, with refineries operating 24 hours a day, 365 days a year. Although the proportions of individual refined products can vary depending on market demand and other factors, the majority of crude oil will continue to become fuel for the world’s transport and utilities.
The Difficulty of Cutting Down on Crude Oil
From the burning of heavy fuels that tarnish icebergs found in Arctic waters to the mounds of plastic made with petrochemicals that end up in our rivers, each barrel of oil and its refined products impact our environment in many different ways. But even as the world works to reduce its consumption of fossil fuels in order to reach climate goals, a world without crude oil seems unfathomable. Skyrocketing sales of EVs still haven’t managed to curb petroleum consumption in places like Norway, California, and China, and the steady reopening of travel and the economy will only result in increased petroleum consumption. Completely replacing the multi-faceted “black gold” that’s in a barrel of oil isn’t possible right now, but as electrification continues and we find alternatives to petrochemical materials, humanity might at least manage to reduce its dependence on burning fossil fuels. on Aside from the obvious climate impact they bring, one other downside in particular is spills, which can lead to ecological and economic damage. These can happen due to pipeline leaks, train derailments, or other industrial disasters. This graphic from Preyash Shah provides a visual overview of every oil and gas spill in the contiguous U.S. since 2010. Data is tracked by the U.S. government’s Pipeline and Hazardous Materials Safety Administration (PHMSA).
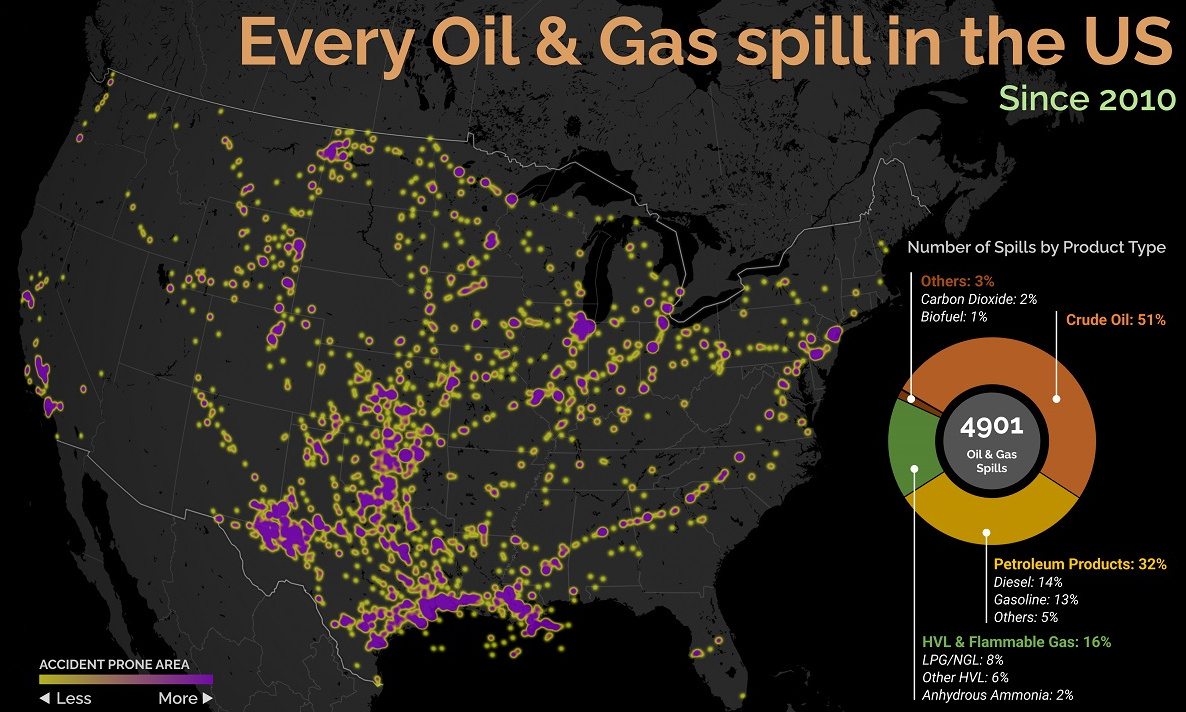
U.S. Oil and Gas Spills (2010‒2022)
The majority of spills that have occurred come mostly from crude oil, followed by petroleum products and gas. Note that this data covers the quantity of spills and not damages or volume.
Crude oil, which makes up just over half of documented spills, is also one of the most costly. Contaminations can persist for years after a spill, and its impact on local mammals and waterfowl is particularly harsh. This has been the case with the Deepwater Horizon spill (also known as the “BP oil spill”), which experts say is still causing harm in the Gulf of Mexico. Other products with lots of spills include petroleum products such as diesel or gasoline, as well as liquefied natural gas or other volatile liquids. Interestingly, liquefied carbon dioxide can also be transported in pipelines, commonly used for carbon capture storage, but requires high pressure to maintain its state. When looking at the location of spills, it’s clear that the South Central states have experienced the highest number of disasters. In contrast, the West Coast has had substantially less activity. However, this makes much more sense when looking at the dominant oil producing states, where Texas and surrounding neighbors reign supreme. Of the 4,901 spills during this period, Texas accounts for 1,936 or roughly 40% of all oil and gas spills. This is followed by Oklahoma, which has had 407 spills and is one of the largest net exporters of oil and gas in the country.
What Causes Spills?
Oil and gas spills actually have a surprisingly long history, with one of the earliest dating back to 1889, when a spill was reported on the coast between Los Angeles and San Diego. Causes have consisted primarily of weather, natural disasters, equipment and technological malfunction, as well as human error. However, they only became a widespread problem around the halfway mark of the 20th century, when petroleum extraction and production really began to take off. This era also saw the emergence of supertankers, which can transport half a million tons of oil but therefore make the risk of spills even costlier. In fact, the biggest spill off U.S. waters after the Deepwater Horizon disaster is the 1989 Exxon Valdez spill in Alaska, when a tanker crashed into a reef and 11 million gallons of oil spilled into the Pacific Ocean.