Just last year, the global banking industry cashed in an impressive $1.36 trillion in after-tax profits — the highest total in the sector seen in the last 20 years. What are the drivers behind revenue and profits in the financial services sector, and where do the biggest opportunities exist in the future?
Following the Money
Today’s infographic comes to us from McKinsey & Company, and it leverages proprietary insights from their Panorama database. Using data stemming from more than 60 countries, we’ve broken down historical banking profits by region, while also visualizing key ratios that help demonstrate why specific countries are more profitable for the industry. Finally, we’ve also looked at the particular geographic regions that may present the biggest opportunities in the future, and why they are relevant today.
Banking Profits, by Region
Before we look at what’s driving banking profits, let’s start with a breakdown of annual after-tax profits by region over time. Banking Profit by Year and Region ($B) In 2018, the United States accounted for $403 billion of after-tax profits in the banking sector — however, China sits in a very close second place, raking in $333 billion.
What’s Under the Hood?
While there’s no doubt that financial services can be profitable in almost any corner of the globe, what is less obvious is where this profit actually comes from. The truth is that banking can vary greatly depending on location — and what drives value for banks in one country may be completely different from what drives value in another. Let’s look at data and ratios from four very different places to get a sense of how financial services markets can vary.
- RARC / GDP (Revenues After Risk Costs / GDP) This ratio shows compares a country’s banking revenues to overall economic production, giving a sense of how important banking is to the economy. Using this, you can see that banking is far more important to Singapore’s economy than others in the table.
- Loans Penetration / GDP Loans penetration can be further broken up into retail loans and wholesale loans. The difference can be immediately seen when looking at data on China and the United States: In America, banks make loans primarily to the retail sector. In China, there’s a higher penetration on a wholesale basis — usually loans being made to corporations or other such entities.
- Margins (Revenues Before Risk Costs / Total Loans) Margins made on lending is one way for bankers to gauge the potential of a market, and as you can see above, margins in the United States and China are both at (or above) the global average. Meanwhile, for comparison, Finland has margins that are closer to half of the global average.
- Risk Cost Margin (Risk Cost / Total Loans) Not surprisingly, China still holds higher risk cost margins than the global average. On the flipside, established markets like Singapore, Finland, and the U.S. all have risk margins below the global average.
Future Opportunities in Banking
While this data is useful at breaking down existing markets, it can also help to give us a sense of future opportunities as well. Here are some of the geographic markets that have the potential to grow into key financial services markets in the future:
A Changing Landscape in Banking
As banks shift focus to face new market challenges, the next chapter of banking may be even more interesting than the last. Add in the high stakes around digital transformation, aging populations, and new service opportunities, and the distance between winners and losers could lengthen even more. Where will the money in banking be in the future? on In this infographic, we’ve visualized data from the Fed’s most recent consumer debt update.
Aggressive Borrowing
The first chart in this graphic shows the growth in outstanding car loans between Q2 2020 (start of the pandemic) to Q4 2022 (latest available). We can see that Americans under the age of 40 have grown their vehicle-related debt the most. It’s natural for Gen Z (ages 11-26) to have higher growth figures because many of them are buying their first car, but 31% is quite high relatively speaking. Part of this can be attributed to today’s inflationary environment, which has pushed used car prices to new highs. Supply chain issues have also resulted in over 30% of new cars being sold above MSRP. Because of these rising prices, the Fed reports that the average auto loan is now $24,000, up 41% from 2019’s value of $17,000.
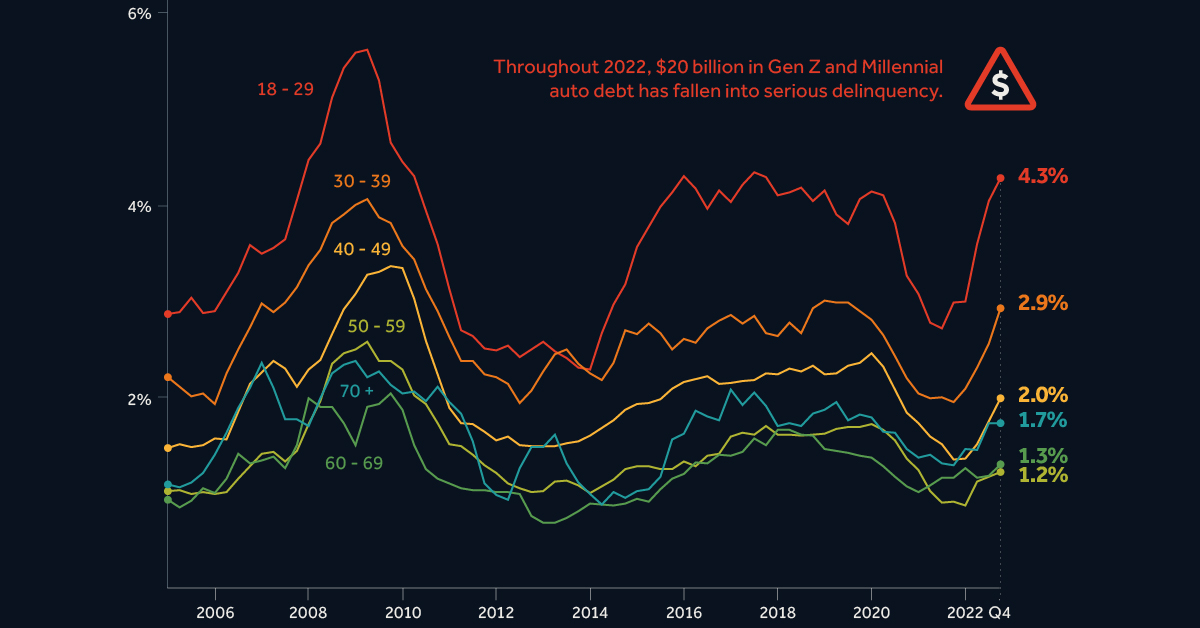
Spiking Delinquencies
Interest rates on auto loans are typically fixed, meaning many young Americans were able to take advantage of the low rates seen during the pandemic. Despite this, one in five Gen Zs say that their car payments account for over 20% of their after-tax income. Shown in the second chart of this infographic, the amount of auto debt transitioning into serious delinquency is much higher for Gen Z and Millennials. Throughout 2022, these generations saw $20 billion in auto debt fall 90+ days behind. The outlook for these struggling borrowers is bleak. First there’s inflation, which has pushed up the prices of most consumer goods. This eats into their ability to make car payments. Second is rising interest rates, which make credit card debt—another pain point for young borrowers—even more costly. Finally, there’s student loans, which are expected to resume in summer 2023. Payments on student debt have been suspended since the beginning of the COVID-19 pandemic.