Between the looming threat of trade wars and growing geopolitical uncertainty, the market also skipped a beat. Volatility took center stage, and the S&P 500 finished in negative territory for the first time in 10 years. Although many asset classes finished in negative territory, a look at fund flows – essentially where investors put their money – helps paint a more intricate picture of the year for investors.
Visualizing 2018 Fund Flows
Today’s infographic comes to us from New York Life Investments, and it visualizes the flows in and out of U.S. funds for 2018. It not only shows when investors poured money into mutual funds or ETFs, but it also breaks down these funds by various categorizations. For example, when did people buy funds that held U.S. equities, and when did they buy funds that primarily held money market securities? Let’s dive into the data, to take a deeper look.
Mutual Funds vs. ETFs
For another year in a row, ETFs gained ground on mutual funds: However, despite growing for another year, ETFs still make up a smaller part of the overall fund universe.
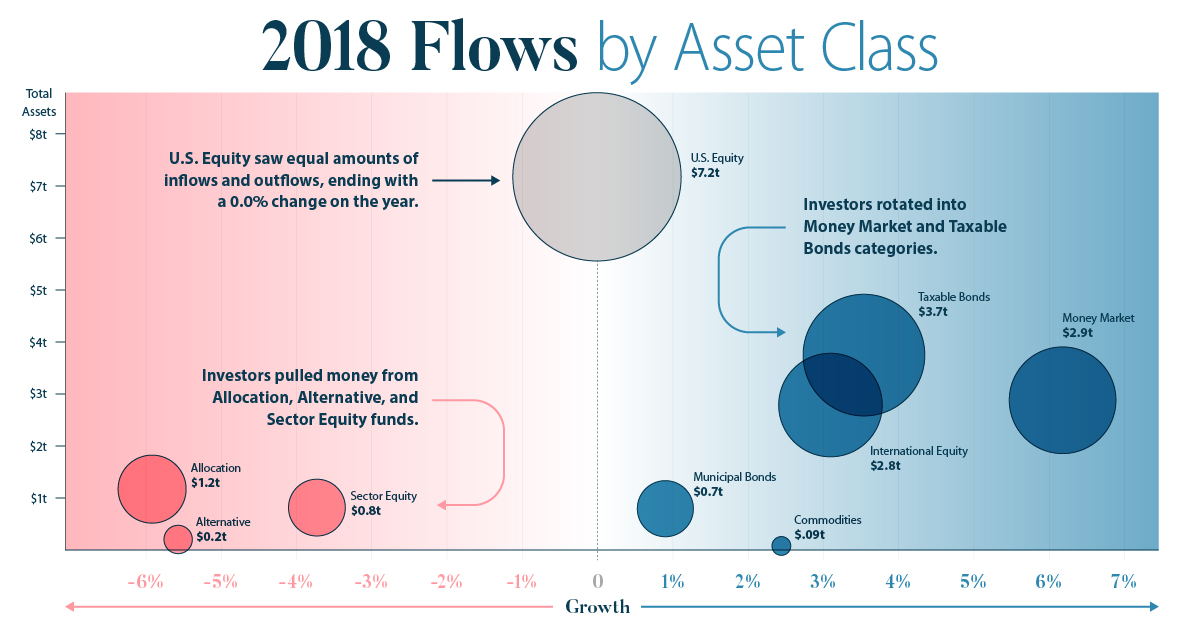
Flows by Asset Class Group
Every fund gets classified by Morningstar based on the types of assets it holds. For example, a fund that focuses on holding fast-growing, large tech companies in the U.S. would be classified broadly as “U.S. Equity”, and more specifically as “U.S. Equity – Large Growth”. Here’s how flows went, within these broader groups: Investors pulled money from Allocation, Alternative, and Sector Equity funds, while rotating into Money Market and Taxable Bonds categories. These latter assets are considered safer, and this shift is not surprising considering the market volatility towards the end of the year. Also interesting here is that U.S. Equity – the biggest category overall by total assets – saw equal amounts of inflows and outflows, ending with a 0.0% change on the year.
U.S. Equity: A Closer Look
U.S. Equity ended the year with zero change, but it’s also the biggest and broadest category. Let’s break it down further – first, we’ll look at what happened to flows by market capitalization (small, mid, and large cap stocks): Investment in funds that held large cap stocks increased by 0.2%, while the money allocated to small caps rose by 1.7% over 2018. Interestingly, investors pulled money out of mid caps (-2.5%). Now, let’s look at U.S. Equity by type of strategy: According to these flows, investors pulled money from funds focused solely on value or growth, while instead preferring funds that were a blend of the two strategies.
International Equities
Finally, let’s see the types of international funds that investors bought and sold over 2018. Investors eschewed funds that had a primary focus on European, Indian, and Japanese markets, while piling into funds that held Chinese equities. Meanwhile, Latin America and emerging markets also got some love from investors.
Conclusion
While 2018 was an eventful year for markets, this recap shows that investors are adjusting their portfolios accordingly. Where will investors put their money in 2019? on These are in the form of Treasury securities, some of the most liquid assets worldwide. Central banks use them for foreign exchange reserves and private investors flock to them during flights to safety thanks to their perceived low default risk. Beyond these reasons, foreign investors may buy Treasuries as a store of value. They are often used as collateral during certain international trade transactions, or countries can use them to help manage exchange rate policy. For example, countries may buy Treasuries to protect their currency’s exchange rate from speculation. In the above graphic, we show the foreign holders of the U.S. national debt using data from the U.S. Department of the Treasury.
Top Foreign Holders of U.S. Debt
With $1.1 trillion in Treasury holdings, Japan is the largest foreign holder of U.S. debt. Japan surpassed China as the top holder in 2019 as China shed over $250 billion, or 30% of its holdings in four years. This bond offloading by China is the one way the country can manage the yuan’s exchange rate. This is because if it sells dollars, it can buy the yuan when the currency falls. At the same time, China doesn’t solely use the dollar to manage its currency—it now uses a basket of currencies. Here are the countries that hold the most U.S. debt: As the above table shows, the United Kingdom is the third highest holder, at over $655 billion in Treasuries. Across Europe, 13 countries are notable holders of these securities, the highest in any region, followed by Asia-Pacific at 11 different holders. A handful of small nations own a surprising amount of U.S. debt. With a population of 70,000, the Cayman Islands own a towering amount of Treasury bonds to the tune of $284 billion. There are more hedge funds domiciled in the Cayman Islands per capita than any other nation worldwide. In fact, the four smallest nations in the visualization above—Cayman Islands, Bermuda, Bahamas, and Luxembourg—have a combined population of just 1.2 million people, but own a staggering $741 billion in Treasuries.
Interest Rates and Treasury Market Dynamics
Over 2022, foreign demand for Treasuries sank 6% as higher interest rates and a strong U.S. dollar made owning these bonds less profitable. This is because rising interest rates on U.S. debt makes the present value of their future income payments lower. Meanwhile, their prices also fall. As the chart below shows, this drop in demand is a sharp reversal from 2018-2020, when demand jumped as interest rates hovered at historic lows. A similar trend took place in the decade after the 2008-09 financial crisis when U.S. debt holdings effectively tripled from $2 to $6 trillion.
Driving this trend was China’s rapid purchase of Treasuries, which ballooned from $100 billion in 2002 to a peak of $1.3 trillion in 2013. As the country’s exports and output expanded, it sold yuan and bought dollars to help alleviate exchange rate pressure on its currency. Fast-forward to today, and global interest-rate uncertainty—which in turn can impact national currency valuations and therefore demand for Treasuries—continues to be a factor impacting the future direction of foreign U.S. debt holdings.