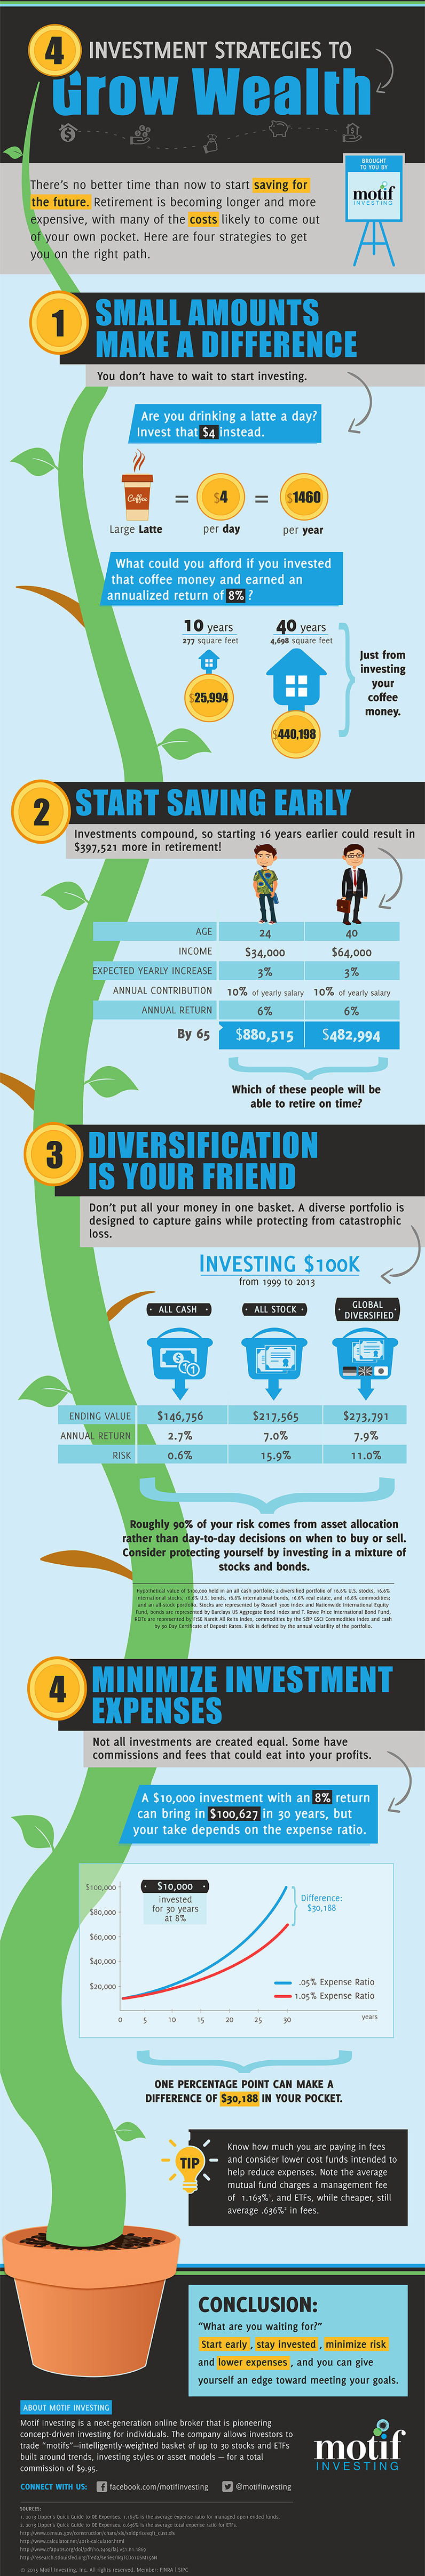
With Investing, Little Things Make a Big Difference
The difference between good and great is often found in the details. As discussed in this infographic, a few little ideas can make a big difference in the long run. First, the equation for growing wealth is actually quite simple: produce more than you consume, and save the difference. Being disciplined and smart means that unnecessary expenses are cut, and any savings can go towards the bottom line. For example, if the money going towards a $4 latte each day was invested, it would amount to $25,994 in 10 years or $440,198 in 40 years. This is based on a fairly ambitious 8% annualized return, but still proves the point. There are other expenses, including some coinciding with investing itself, that can eat away at the bottom line as well. Keep in mind that the investment industry is designed around taking a haircut off of each dollar spent, and that this money helps employ millions of people around the world. Fees, commissions, and other extras can add up. In the above example, a 1% difference in expenses translates to a $30,000 difference to the investor over 30 years. Keep in mind that the average mutual fund charges a whopping 1.163% in fees. Related reading: The Myth of the Successful Money Manager. Two other little things that make a big difference include investing early and proper portfolio diversification. By saving early, those extra years of compound interest can make an impact in the hundreds of thousands of dollars at retirement. By diversifying a portfolio, the example shows that 90% of risk from asset allocation can be avoided. Original graphic from: Motif Investing
on Last year, stock and bond returns tumbled after the Federal Reserve hiked interest rates at the fastest speed in 40 years. It was the first time in decades that both asset classes posted negative annual investment returns in tandem. Over four decades, this has happened 2.4% of the time across any 12-month rolling period. To look at how various stock and bond asset allocations have performed over history—and their broader correlations—the above graphic charts their best, worst, and average returns, using data from Vanguard.
How Has Asset Allocation Impacted Returns?
Based on data between 1926 and 2019, the table below looks at the spectrum of market returns of different asset allocations:
We can see that a portfolio made entirely of stocks returned 10.3% on average, the highest across all asset allocations. Of course, this came with wider return variance, hitting an annual low of -43% and a high of 54%.
A traditional 60/40 portfolio—which has lost its luster in recent years as low interest rates have led to lower bond returns—saw an average historical return of 8.8%. As interest rates have climbed in recent years, this may widen its appeal once again as bond returns may rise.
Meanwhile, a 100% bond portfolio averaged 5.3% in annual returns over the period. Bonds typically serve as a hedge against portfolio losses thanks to their typically negative historical correlation to stocks.
A Closer Look at Historical Correlations
To understand how 2022 was an outlier in terms of asset correlations we can look at the graphic below:
The last time stocks and bonds moved together in a negative direction was in 1969. At the time, inflation was accelerating and the Fed was hiking interest rates to cool rising costs. In fact, historically, when inflation surges, stocks and bonds have often moved in similar directions. Underscoring this divergence is real interest rate volatility. When real interest rates are a driving force in the market, as we have seen in the last year, it hurts both stock and bond returns. This is because higher interest rates can reduce the future cash flows of these investments. Adding another layer is the level of risk appetite among investors. When the economic outlook is uncertain and interest rate volatility is high, investors are more likely to take risk off their portfolios and demand higher returns for taking on higher risk. This can push down equity and bond prices. On the other hand, if the economic outlook is positive, investors may be willing to take on more risk, in turn potentially boosting equity prices.
Current Investment Returns in Context
Today, financial markets are seeing sharp swings as the ripple effects of higher interest rates are sinking in. For investors, historical data provides insight on long-term asset allocation trends. Over the last century, cycles of high interest rates have come and gone. Both equity and bond investment returns have been resilient for investors who stay the course.