Looking beyond these big picture gains, many communities in the United States are struggling. Check cashing stores outnumber McDonald’s locations, the opioid epidemic rages on, and tens of millions are living in poverty around the country. It’s becoming more clear that the recovery from the financial crisis has been highly uneven.
The Data Behind Distress
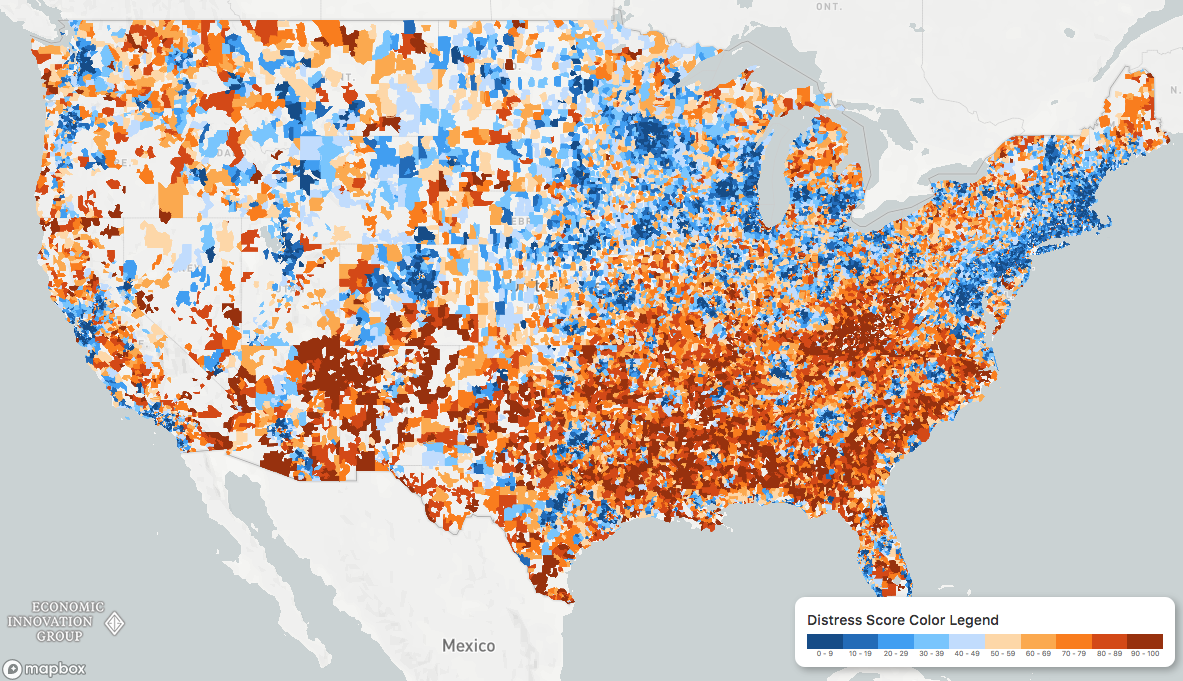
To understand the disconnect between struggling counties and a high-flying national economy, researchers at the Economic Innovation Group (EIG) created the Distressed Communities Index: To calculate the “health” of communities around the country, the Economic Innovation Group (EIG) looked at everything from vacancy rates to median income ratios. When visualized, a picture emerges of an America divided into superstar regions and broad expanses of struggling communities. – Distressed Communities Index Report (2018)
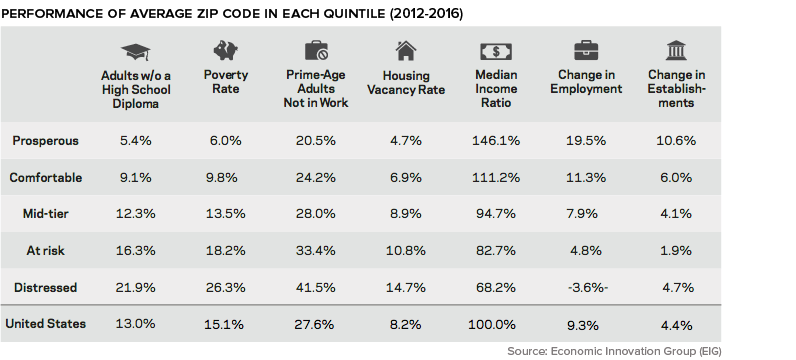
Community Quintiles
When communities are divided into quintiles, stark patterns emerge. In the most distressed zip codes, over 40% of “prime-age” adults are unemployed, one-in-five adults did not graduate high school, and the housing vacancy rate is nearly double the U.S. average.
As well, deaths related to substance abuse and mental illness are 64% higher in distressed communities.
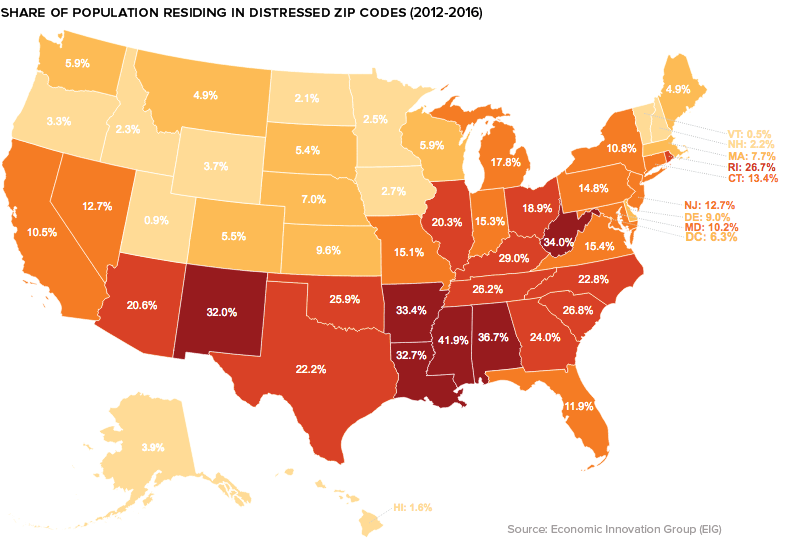
Struggling States and Cities
The DCI data reveals that those living in the lower half of the United States are more likely to call a distressed community home. In Alabama, Arkansas, Mississippi, and West Virginia, one-third or more of the population resides in the bottom quintile of zip codes.
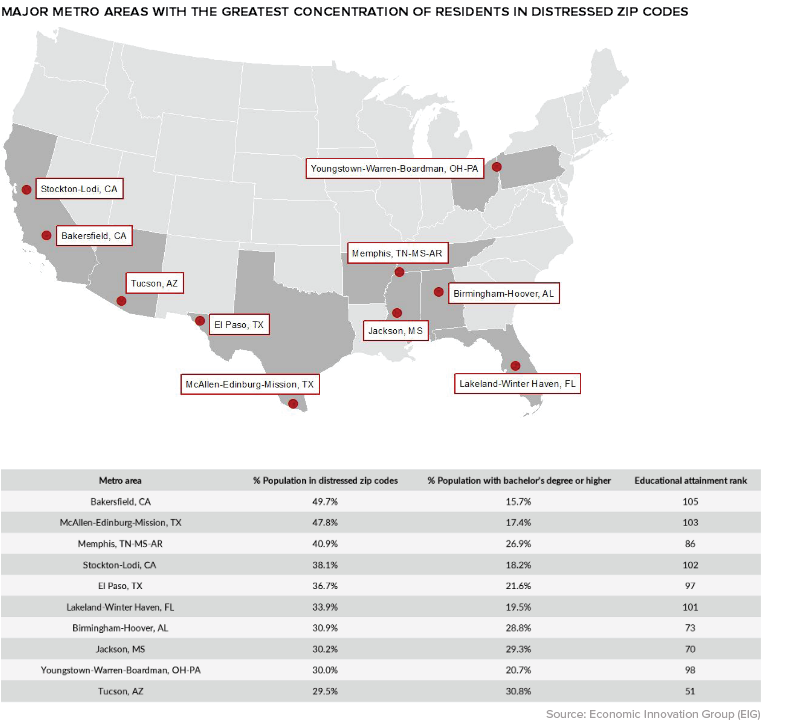
On the flip side, in Colorado, Minnesota, Massachusetts, New Hampshire, and Utah well over 40% of the population live in prosperous zip codes. Zooming in beyond the state-level, a geographical trend becomes clear: many of the struggling communities in the index are classified as rural. Between 2007 and 2016, nearly a third of all rural zip codes were considered “downwardly mobile”, compared to only 16% of those in urban areas. Though rural zip codes tend to fare worse than their more urban counterparts, there are exceptions to that trend. One example is Bakersfield, California, where almost half of the city’s population lives in a distressed community.
on To see how the minimum wage differs around the world, we’ve visualized data from Picodi, which includes values for 67 countries as of January 2023.
Monthly Minimum Wage, by Country
The following table includes all of the data used in this infographic. Each value represents the monthly minimum wage a full-time worker would receive in each country. Picodi states that these figures are net of taxes and have been converted to USD. Generally speaking, developed countries have a higher cost of living, and thus require a higher minimum wage. Two outliers in this dataset are Argentina and Turkey, which have increased their minimum wages by 100% or more from January 2022 levels. Turkey is suffering from an ongoing currency crisis, with the lira losing over 40% of its value in 2021. Prices of basic goods have increased considerably as the Turkish lira continues to plummet. In fact, a 2022 survey found that 70% of people in Turkey were struggling to pay for food. Argentina, South America’s second-biggest economy, is also suffering from very high inflation. In response, the country announced three minimum wage increases throughout 2022.
Minimum Wage in the U.S.
Within the U.S., minimum wage varies significantly by state. We’ve visualized each state’s basic minimum rate (hourly) using January 2023 data from the U.S. Department of Labor.
2023-03-17 Update: This map was updated to fix several incorrect values. We apologize for any confusion this may have caused. America’s federal minimum wage has remained unchanged since 2009 at $7.25 per hour. Each state is allowed to set their own minimum wage, as long as it’s higher than the federal minimum. In states that do not set their own minimum, the federal minimum applies. If we assume someone works 40 hours a week, the federal minimum wage of $7.25 translates to an annual figure of just $15,080 before taxes. California’s minimum wage of $15.50 translates to $32,240 before taxes. For further perspective, check out our 2022 infographic on the salary needed to buy a home across 50 U.S. cities.