Today’s interactive visualization was created by HealthDataViz consultant Lindsay Betzendahl, who also founded #ProjectHealthViz. The data considers how healthcare spending by country stacks up across the 36 Organization for Economic Cooperation (OECD) members, and how it has changed since 2010. One thing is clear—the United States comes in first place in each category, but that’s not necessarily a good thing: *Although Costa Rica’s figure was higher in 2016, more recent data is not yet available. Let’s look at each individual cost category, to see what else we can learn.
What Portion of GDP Goes Towards Health?
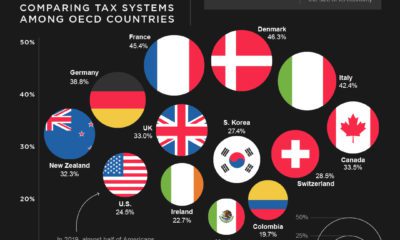
Population health is a strong determinant in quality of life. As such, how much a country spends on healthcare as a percentage of gross domestic product (GDP) can be an important indicator. The U.S. spends 16.9% of GDP on its healthcare, nearly double the OECD average of 8.8%. That’s also over 4 percentage points (p.p.) above Switzerland, which ranks second with 12.2% healthcare spending by GDP. The problem? While Switzerland consistently ranks as having one of the best healthcare systems in the world, the U.S. lags behind—which means that expenditures are not always translating into better health outcomes for patients.
Where’s the Money Going?
Looking after the health of millions of people is a lot of work, and this is where spending on healthcare administration and financing comes into play. Funds are allocated to medical resource providers, who manage everything from health records to salaries and insurance bills. The U.S. spends about 8.3% of its total healthcare expenditures on these complex costs today, which is a marginal increase from 7.5% in 2010. Interestingly, Costa Rica’s healthcare spending on the same metric was even higher in 2016, at 9.5% of the total. On the bright side, Mexico has been making strides in the past few years: administrative spending plunged from 10.3% in 2013, down to 4.6% in 2017. Globally, advancements in health-tech are helping to reduce costs by streamlining tedious processes. However, it’s still not enough—and these immense costs trickle down to patients.
How Much Does Each Person Shell Out?
Over the past eight years, a majority of OECD countries have seen their healthcare spending per capita climb, with Luxembourg and Greece being the only exceptions. The average OECD country’s spend was $3,992 per capita in 2018, up from $3,080 in 2010—nearly a 30% increase. However, the U.S. experiences the most dramatic sticker shock by far. At $10,586 per head, the U.S. average is already more than double the OECD average. What’s more, this is a 33.3% increase from $7,939 in healthcare spending per capita in 2010. As the U.S. healthcare reform debate around prices and quality of care rages on, it’s important to remember that healthy people are the backbone of any country’s long-term economic growth.
on Both figures surpassed analyst expectations by a wide margin, and in January, the unemployment rate hit a 53-year low of 3.4%. With the recent release of February’s numbers, unemployment is now reported at a slightly higher 3.6%. A low unemployment rate is a classic sign of a strong economy. However, as this visualization shows, unemployment often reaches a cyclical low point right before a recession materializes.
Reasons for the Trend
In an interview regarding the January jobs data, U.S. Treasury Secretary Janet Yellen made a bold statement: While there’s nothing wrong with this assessment, the trend we’ve highlighted suggests that Yellen may need to backtrack in the near future. So why do recessions tend to begin after unemployment bottoms out?
The Economic Cycle
The economic cycle refers to the economy’s natural tendency to fluctuate between periods of growth and recession. This can be thought of similarly to the four seasons in a year. An economy expands (spring), reaches a peak (summer), begins to contract (fall), then hits a trough (winter). With this in mind, it’s reasonable to assume that a cyclical low in the unemployment rate (peak employment) is simply a sign that the economy has reached a high point.
Monetary Policy
During periods of low unemployment, employers may have a harder time finding workers. This forces them to offer higher wages, which can contribute to inflation. For context, consider the labor shortage that emerged following the COVID-19 pandemic. We can see that U.S. wage growth (represented by a three-month moving average) has climbed substantially, and has held above 6% since March 2022. The Federal Reserve, whose mandate is to ensure price stability, will take measures to prevent inflation from climbing too far. In practice, this involves raising interest rates, which makes borrowing more expensive and dampens economic activity. Companies are less likely to expand, reducing investment and cutting jobs. Consumers, on the other hand, reduce the amount of large purchases they make. Because of these reactions, some believe that aggressive rate hikes by the Fed can either cause a recession, or make them worse. This is supported by recent research, which found that since 1950, central banks have been unable to slow inflation without a recession occurring shortly after.
Politicians Clash With Economists
The Fed has raised interest rates at an unprecedented pace since March 2022 to combat high inflation. More recently, Fed Chairman Jerome Powell warned that interest rates could be raised even higher than originally expected if inflation continues above target. Senator Elizabeth Warren expressed concern that this would cost Americans their jobs, and ultimately, cause a recession. Powell remains committed to bringing down inflation, but with the recent failures of Silicon Valley Bank and Signature Bank, some analysts believe there could be a pause coming in interest rate hikes. Editor’s note: just after publication of this article, it was confirmed that U.S. interest rates were hiked by 25 basis points (bps) by the Federal Reserve.