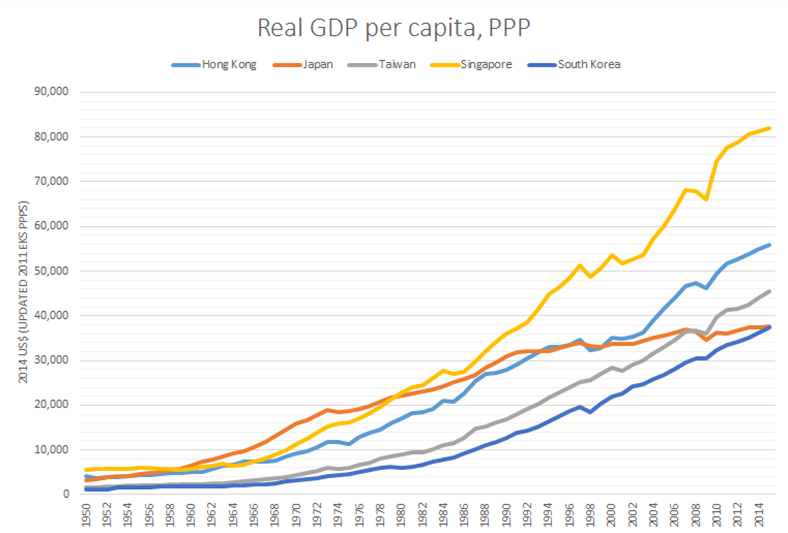
Japan Officially Gets Leapfrogged by the Four Asian Tigers
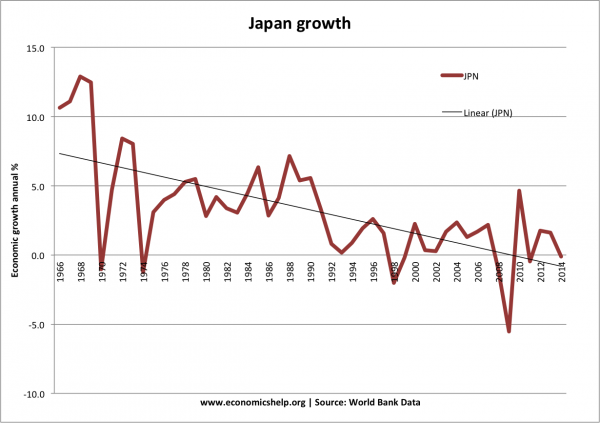
Throughout the decades in the 1950s and 1960s, the Japanese economy was envied for its unrelenting growth. Dubbed the “Post-War Miracle”, this period of time saw Japan become a global center of manufacturing and exports. Japanese brands such as Toyota, Sony, Honda, Mitsubishi, Panasonic, and Canon would become household names worldwide. By the 1960s, Japan catapulted to become the second largest economy in the world. Today, Japan has the third largest economy in terms of total nominal GDP, and the fourth largest by GDP adjusted for Purchasing Power Parity (PPP). This doesn’t seem so bad on paper, but Japan also has nearly 130 million people. What do those amounts look like per capita? It turns out to be not so good. After over two decades of economic stagnation, the most recent GDP per capita (PPP) numbers for 2014 by the IMF had the Japanese economy in 29th place globally. As you saw in the opening chart, even more recent projections from another source show that all four Asian Tigers have now all officially leapfrogged Japan in terms of GDP per capita (PPP). The “Four Asian Tigers”, a term used to reference the highly free-market and developed economies of Hong Kong, Singapore, South Korea, and Taiwan, have continued to grow despite Japan’s struggles. Singapore, a significant Asian banking center, passed Japan in GDP per capita (PPP) back in 1979. Hong Kong would be the next to do so in 1993, and Taiwan would jump ahead during the Financial Crisis. The last of the leapfrogging happened when South Korea passed Japan this year. This shouldn’t be too surprising, as the struggles of Japan over the last 25 years have been well-documented. However, a point of interest may be the context of how these challenges began. In the mid-80s, the yen had basically doubled in value against the dollar. For a manufacturing and exporting nation (similar to how China is today), this was less than ideal. While this was happening, the Bank of Japan intervened with five sessions of monetary easing starting in January 1986 to weaken the yen, cutting interest rates from 5.0% to 2.5% in just one year. During this time, monetary growth was much quicker than anticipated. More-than-sufficient liquidity and ultra low interest rates fueled speculation, which helped lead to inflate a classic asset bubble. In the early 90s, the BOJ hiked rates to counter speculation and curb inflation. The asset bubble popped, and Japan’s economy would be sent into the “Lost Decade” – a “decade” which has lasted 25 years.
You can see the drastic increase in money supply leading up to the crisis here:
Japan now has the world’s highest debt-to-GDP ratio of 243% as well as the world’s highest debt-to-revenue ratio. Despite this, they’ve started an even more potentially dangerous experiment known as Abenomics, which is the three-headed beast of unprecedented quantitative easing, monetary stimulus, and reforms. Original graphics by: Utopia – You’re Standing In It (blog), Trading Economics
on The good news is that the Federal Reserve, U.S. Treasury, and Federal Deposit Insurance Corporation are taking action to restore confidence and take the appropriate measures to help provide stability in the market. With this in mind, the above infographic from New York Life Investments looks at the factors that impact bonds, how different types of bonds have historically performed across market environments, and the current bond market volatility in a broader context.
Bond Market Returns
Bonds had a historic year in 2022, posting one of the worst returns ever recorded. As interest rates rose at the fastest pace in 40 years, it pushed bond prices lower due to their inverse relationship. In a rare year, bonds dropped 13%.
Source: FactSet, 01/02/2023.
Bond prices are only one part of a bond’s total return—the other looks at the income a bond provides. As interest rates have increased in the last year, it has driven higher bond yields in 2023.
Source: YCharts, 3/20/2023.
With this recent performance in mind, let’s look at some other key factors that impact the bond market.
Factors Impacting Bond Markets
Interest rates play a central role in bond market dynamics. This is because they affect a bond’s price. When rates are rising, existing bonds with lower rates are less valuable and prices decline. When rates are dropping, existing bonds with higher rates are more valuable and their prices rise. In March, the Federal Reserve raised rates 25 basis points to fall within the 4.75%-5.00% range, a level not seen since September 2007. Here are projections for where the federal funds rate is headed in 2023:
Federal Reserve Projection*: 5.1% Economist Projections**: 5.3%
*Based on median estimates in the March summary of quarterly economic projections.**Projections based on March 10-15 Bloomberg economist survey. Together, interest rates and the macroenvironment can have a positive or negative effect on bonds.
Positive
Here are three variables that may affect bond prices in a positive direction:
Lower Inflation: Reduces likelihood of interest rate hikes. Lower Interest Rates: When rates are falling, bond prices are typically higher. Recession: Can prompt a cut in interest rates, boosting bond prices.
Negative
On the other hand, here are variables that may negatively impact bond prices:
Higher Inflation: Can increase the likelihood of the Federal Reserve to raise interest rates. Rising Interest Rates: Interest rate hikes lead bond prices to fall. Weaker Fundamentals: When a bond’s credit risk gets worse, its price can drop. Credit risk indicates the chance of a default, the risk of a bond issuer not making interest payments within a given time period.
Bonds have been impacted by these negative factors since inflation started rising in March 2021.
Fixed Income Opportunities
Below, we show the types of bonds that have had the best performance during rising rates and recessions.
Source: Derek Horstmeyer, George Mason University 12/3/2022. As we can see, U.S. ultrashort bonds performed the best during rising rates. Mortgage bonds outperformed during recessions, averaging 11.4% returns, but with higher volatility. U.S. long-term bonds had 7.7% average returns, the best across all market conditions. In fact, they were also a close second during recessions. When rates are rising, ultrashort bonds allow investors to capture higher rates when they mature, often with lower historical volatility.
A Closer Look at Bond Market Volatility
While bond market volatility has jumped this year, current dislocations may provide investment opportunities. Bond dislocations allow investors to buy at lower prices, factoring in that the fundamental quality of the bond remains strong. With this in mind, here are two areas of the bond market that may provide opportunities for investors:
Investment-Grade Corporate Bonds: Higher credit quality makes them potentially less vulnerable to increasing interest rates. Intermediate Bonds (2-10 Years): Allow investors to lock in higher rates.
Both types of bonds focus on quality and capturing higher yields when faced with challenging market conditions.
Finding the Upside
Much of the volatility seen in the banking sector was due to banks buying bonds during the pandemic—or even earlier—at a time when interest rates were historically low. Since then, rates have climbed considerably. Should rates moderate or stop increasing, this may present better market conditions for bonds. In this way, today’s steep discount in bond markets may present an attractive opportunity for price appreciation. At the same time, investors can potentially lock in strong yields as inflation may subside in the coming years ahead. Learn more about bond investing strategies with New York Life Investments.