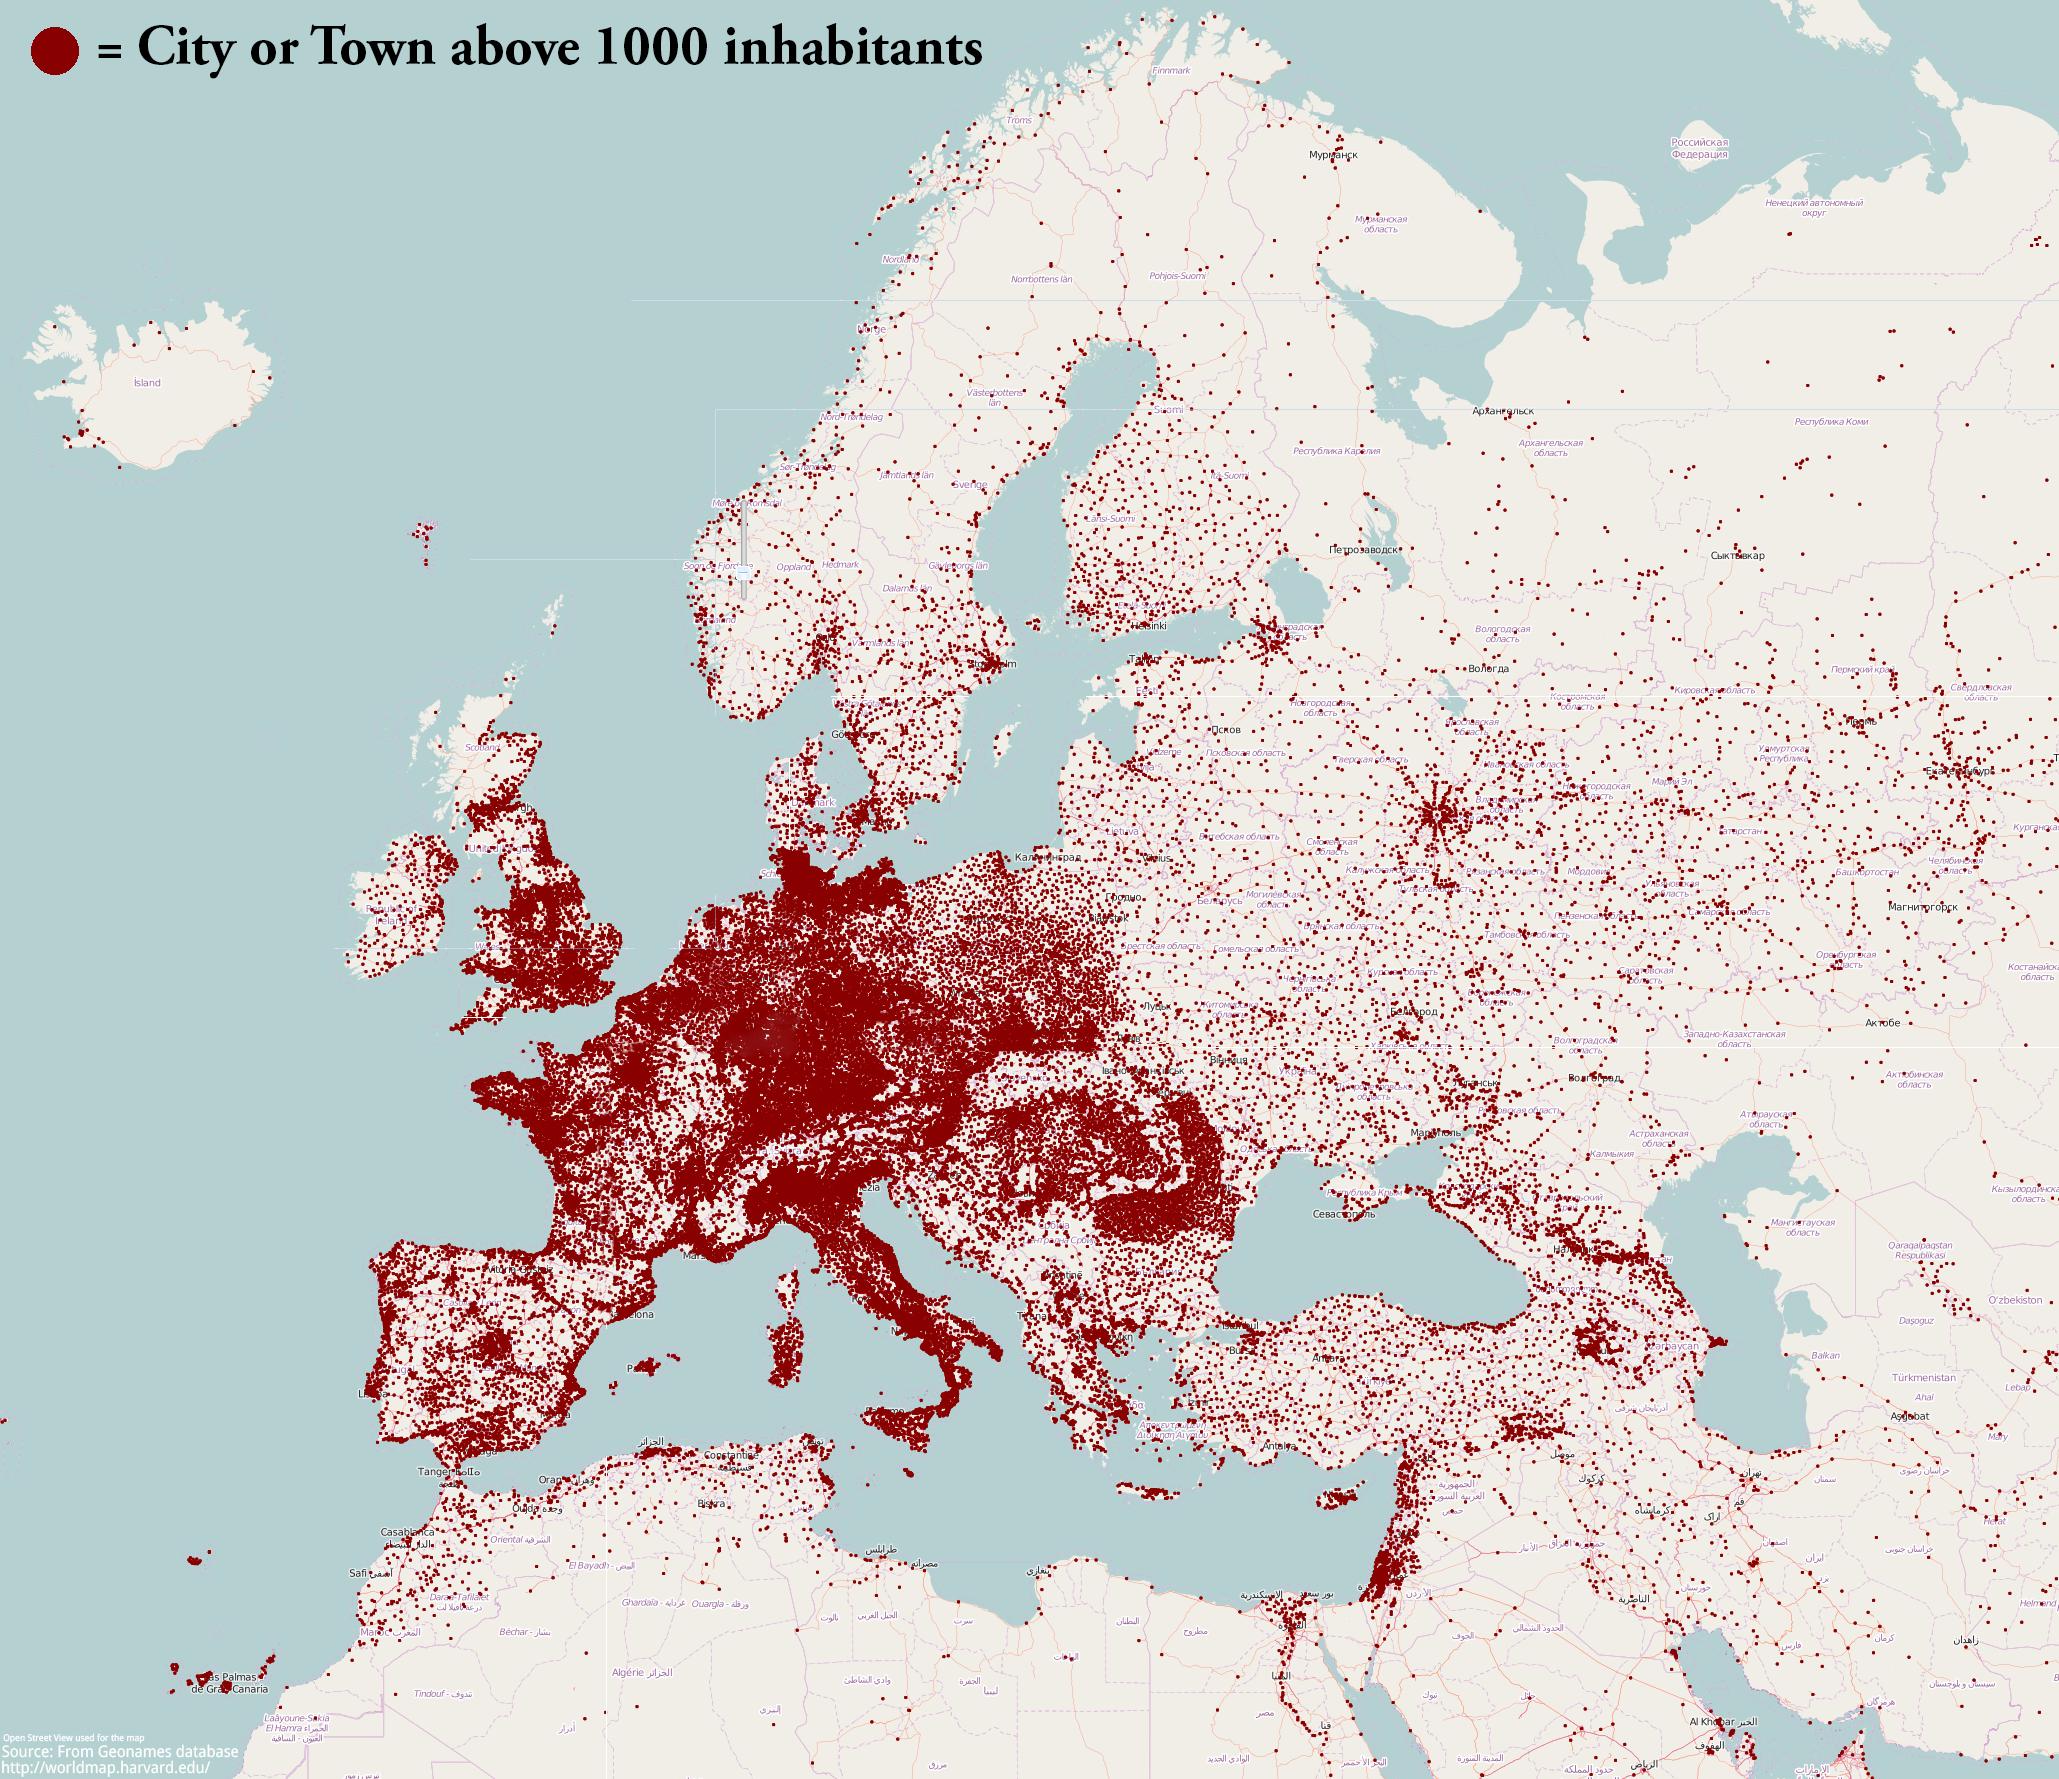
One method, for example, would be to color regions based on people per unit of land. This could be done at the county, state, or national levels with varying results. Alternatively, you could show density more abstractly, such as in this compelling map of the Pearl River Delta in China. But one surprisingly insightful method for looking at population density is deceivingly simple: just put a dot on the map for every town with 1,000 people or more, and the results will give you a sense of where people live on a macro scale.
Replacing Towns With Dots
Using the dot methodology, it means New York City is the same size as Anytown, USA. This seems crazy, right? Although this is surely a drawback, the results are still pretty interesting. After all, hubs like New York City are centers of commerce and culture, and they are surrounded by hundreds of other nearby towns. Let’s take a look at (most of) North America:
A few things that are noticeable right away? You can see the difference in topography between the plains and the more mountainous part of the continent. In flatter places like Nebraska or Saskatchewan, the towns are evenly spread out – and in regions with uneven geography, such as Colorado or British Columbia, towns are typically located in the valleys. Further, the density in the Northeastern part of the United States and surrounding the Great Lakes work to provide quite a contrast to the emptier parts of the continent. Natural features like the Everglades are also quite easy to spot on the map – it’s one of the only non-populated areas in an otherwise dense Florida. If you look at the northwestern tip of Wyoming, you’ll also see a lack of dots in the 2 million acres of Yellowstone National Park.
Europe and MENA
Now let’s go across the Atlantic – here’s a map of Europe, North Africa, and most of the Middle East. (Click to open a larger version) This map is also pretty spectacular – you can see the cities along the Nile, the “eye” of Moscow, and impressive amounts of population density in places like Belgium, Holland, Germany and Switzerland.
World View
While we haven’t seen a world map using this method, it’s not hard to imagine what places like India, China, Japan, or Bangladesh could look like with dots replacing each town within their borders. These are the densest parts of the world – to even more extreme levels than the denser parts of Europe shown above. Here’s a more standard population density map, using people per square kilometer, to give you an idea:
If you’re looking for more perspective on global population density, this unique map is worth a look. It shows how dense the aforementioned Asian region above is in a very compelling and simple way.
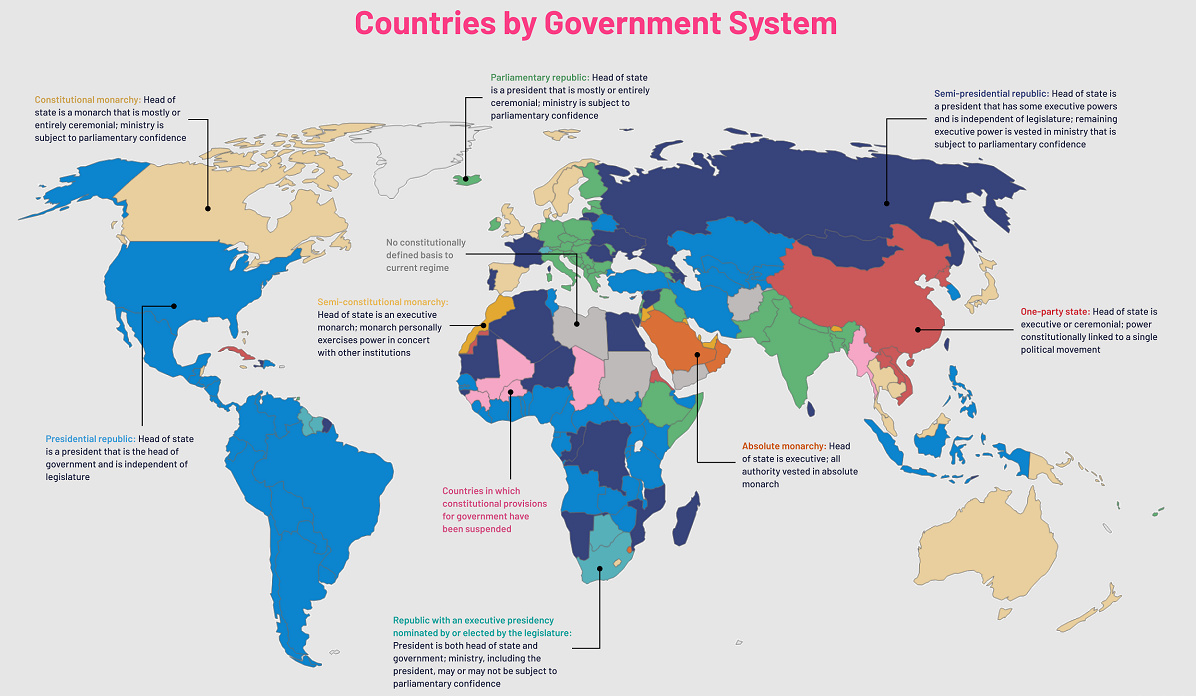
on Even while political regimes across these countries have changed over time, they’ve largely followed a few different types of governance. Today, every country can ultimately be classified into just nine broad forms of government systems. This map by Truman Du uses information from Wikipedia to map the government systems that rule the world today.
Countries By Type of Government
It’s important to note that this map charts government systems according to each country’s legal framework. Many countries have constitutions stating their de jure or legally recognized system of government, but their de facto or realized form of governance may be quite different. Here is a list of the stated government system of UN member states and observers as of January 2023: Let’s take a closer look at some of these systems.
Monarchies
Brought back into the spotlight after the death of Queen Elizabeth II of England in September 2022, this form of government has a single ruler. They carry titles from king and queen to sultan or emperor, and their government systems can be further divided into three modern types: constitutional, semi-constitutional, and absolute. A constitutional monarchy sees the monarch act as head of state within the parameters of a constitution, giving them little to no real power. For example, King Charles III is the head of 15 Commonwealth nations including Canada and Australia. However, each has their own head of government. On the other hand, a semi-constitutional monarchy lets the monarch or ruling royal family retain substantial political powers, as is the case in Jordan and Morocco. However, their monarchs still rule the country according to a democratic constitution and in concert with other institutions. Finally, an absolute monarchy is most like the monarchies of old, where the ruler has full power over governance, with modern examples including Saudi Arabia and Vatican City.
Republics
Unlike monarchies, the people hold the power in a republic government system, directly electing representatives to form government. Again, there are multiple types of modern republic governments: presidential, semi-presidential, and parliamentary. The presidential republic could be considered a direct progression from monarchies. This system has a strong and independent chief executive with extensive powers when it comes to domestic affairs and foreign policy. An example of this is the United States, where the President is both the head of state and the head of government. In a semi-presidential republic, the president is the head of state and has some executive powers that are independent of the legislature. However, the prime minister (or chancellor or equivalent title) is the head of government, responsible to the legislature along with the cabinet. Russia is a classic example of this type of government. The last type of republic system is parliamentary. In this system, the president is a figurehead, while the head of government holds real power and is validated by and accountable to the parliament. This type of system can be seen in Germany, Italy, and India and is akin to constitutional monarchies. It’s also important to point out that some parliamentary republic systems operate slightly differently. For example in South Africa, the president is both the head of state and government, but is elected directly by the legislature. This leaves them (and their ministries) potentially subject to parliamentary confidence.
One-Party State
Many of the systems above involve multiple political parties vying to rule and govern their respective countries. In a one-party state, also called a single-party state or single-party system, only one political party has the right to form government. All other political parties are either outlawed or only allowed limited participation in elections. In this system, a country’s head of state and head of government can be executive or ceremonial but political power is constitutionally linked to a single political movement. China is the most well-known example of this government system, with the General Secretary of the Communist Party of China ruling as the de facto leader since 1989.
Provisional
The final form of government is a provisional government formed as an interim or transitional government. In this system, an emergency governmental body is created to manage political transitions after the collapse of a government, or when a new state is formed. Often these evolve into fully constitutionalized systems, but sometimes they hold power for longer than expected. Some examples of countries that are considered provisional include Libya, Burkina Faso, and Chad.