Today’s post is the incredible Unified Geologic Map of the Moon from the USGS, which combines information from six regional lunar maps created during the Apollo era, as well as recent spacecraft observations.
Feet on the Ground, Head in the Sky
Since the beginning of humankind, the Moon has captured our collective imagination. It is one of the few celestial bodies visible to the naked eye from Earth. Over time different cultures wrapped the Moon in their own myths. To the Egyptians it was the god Thoth, to the Greeks, the goddess Artemis, and to the Hindus, Chandra. Thoth was portrayed as a wise counselor who solved disputes and invented writing and the 365-day calendar. A headdress with a lunar disk sitting atop a crescent moon denoted Thoth as the arbiter of times and seasons. Artemis was the twin sister of the sun god Apollo, and in Greek mythology she presided over childbirth, fertility, and the hunt. Just like her brother that illuminated the day, she was referred to as the torch bringer during the dark of night. Chandra means the “Moon” in Sanskrit, Hindi, and other Indian languages. According to one Hindu legend, Ganesha—an elephant-headed deity—was returning home on a full moon night after a feast. On the journey, a snake crossed his pathway, frightening his horse. An overstuffed Ganesha fell to the ground on his stomach, vomiting out his dinner. On observing this, Chandra laughed, causing Ganesha to lose his temper. He broke off one of his tusks and hurled it toward the Moon, cursing him so that he would never be whole again. This legend describes the Moon’s waxing and waning including the big crater on the Moon, visible from Earth. Such lunar myths have waned as technology has evolved, removing the mystery of the Moon but also opening up scientific debate.
Celestial Evolution: Two Theories
The pot marks on the Moon can be easily seen from the Earth’s surface with the naked eye, and it has led to numerous theories as to the history of the Moon. Recent scientific study brings forward two primary ideas.
One opinion of those who have studied the Moon is that it was once a liquid mass, and that its craters represent widespread and prolonged volcanic activity, when the gases and lava of the heated interior exploded to the surface.
However, there is another explanation for these lunar craters. According to G. K. Gilbert, of the USGS, the Moon was formed by the joining of a ring of meteorites which once encircled the Earth, and after the formation of the lunar sphere, the impact of meteors produced “craters” instead of arising from volcanic activity.
Either way, mapping the current contours of the lunar landscape will guide future human missions to the Moon by revealing regions that may be rich in useful resources or areas that need more detailed mapping to land a spacecraft safely .
Lay of the Land: Reading the Contours of the Moon
This map is a 1:5,000,000-scale geologic map built from six separate digital maps. The goal was to create a resource for science research and analysis to support future geologic mapping efforts. Mapping purposes divide the Moon into the near side and far side. The far side of the Moon is the side that always faces away from the Earth, while the near side faces towards the Earth. The most visible topographic feature is the giant far side South Pole-Aitken basin, which possesses the lowest elevations of the Moon. The highest elevations are found just to the northeast of this basin. Other large impact basins, such as the Maria Imbrium, Serenitatis, Crisium, Smythii, and Orientale, also have low elevations and elevated rims.
The colors on the map help to define regional features while also highlighting consistent patterns across the lunar surface. Each one of these regions hosts the potential for resources.
Lunar Resources
Only further study will resolve the evolution of the Moon, but it is clear that there are resources earthlings can exploit. Hydrogen, oxygen, silicon, iron, magnesium, calcium, aluminum, manganese, and titanium are some of the metals and minerals on the Moon. Interestingly, oxygen is the most abundant element on the Moon. It’s a primary component found in rocks, and this oxygen can be converted to a breathable gas with current technology. A more practical question would be how to best power this process. Lunar soil is the easiest to mine, it can provide protection from radiation and meteoroids as material for construction. Ice can provide water for radiation shielding, life support, oxygen, and rocket propellant feed stock. Compounds from permanently shadowed craters could provide methane, ammonia, carbon dioxide, and carbon monoxide. This is just the beginning—as more missions are sent to the Moon, there is more to discover.
Space Faring Humans
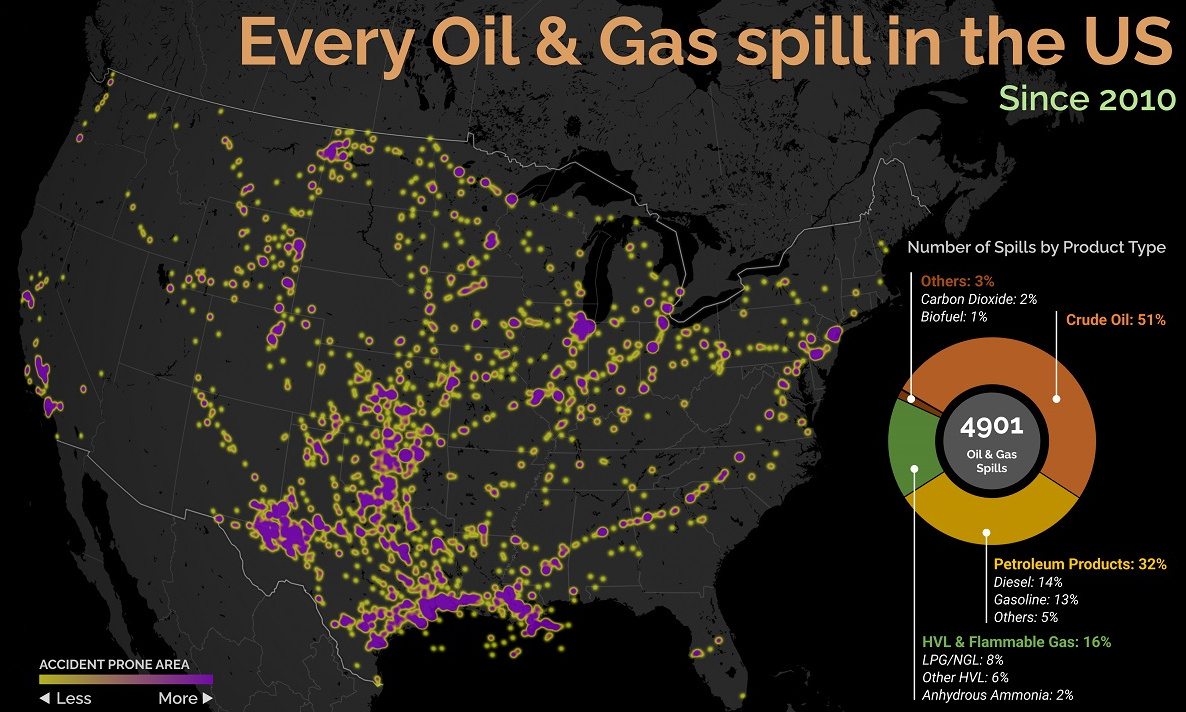
NASA plans to land astronauts—one female, one male—to the Moon by 2024 as part of the Artemis 3 mission, and after that, about once each year. It’s the beginning of an unfulfilled promise to make humans a space-faring civilization. The Moon is just the beginning…the skills learned to map Near-Earth Objects will be the foundation for further exploration and discovery of the universe. on Aside from the obvious climate impact they bring, one other downside in particular is spills, which can lead to ecological and economic damage. These can happen due to pipeline leaks, train derailments, or other industrial disasters. This graphic from Preyash Shah provides a visual overview of every oil and gas spill in the contiguous U.S. since 2010. Data is tracked by the U.S. government’s Pipeline and Hazardous Materials Safety Administration (PHMSA).
U.S. Oil and Gas Spills (2010‒2022)
The majority of spills that have occurred come mostly from crude oil, followed by petroleum products and gas. Note that this data covers the quantity of spills and not damages or volume.
Crude oil, which makes up just over half of documented spills, is also one of the most costly. Contaminations can persist for years after a spill, and its impact on local mammals and waterfowl is particularly harsh. This has been the case with the Deepwater Horizon spill (also known as the “BP oil spill”), which experts say is still causing harm in the Gulf of Mexico. Other products with lots of spills include petroleum products such as diesel or gasoline, as well as liquefied natural gas or other volatile liquids. Interestingly, liquefied carbon dioxide can also be transported in pipelines, commonly used for carbon capture storage, but requires high pressure to maintain its state. When looking at the location of spills, it’s clear that the South Central states have experienced the highest number of disasters. In contrast, the West Coast has had substantially less activity. However, this makes much more sense when looking at the dominant oil producing states, where Texas and surrounding neighbors reign supreme. Of the 4,901 spills during this period, Texas accounts for 1,936 or roughly 40% of all oil and gas spills. This is followed by Oklahoma, which has had 407 spills and is one of the largest net exporters of oil and gas in the country.
What Causes Spills?
Oil and gas spills actually have a surprisingly long history, with one of the earliest dating back to 1889, when a spill was reported on the coast between Los Angeles and San Diego. Causes have consisted primarily of weather, natural disasters, equipment and technological malfunction, as well as human error. However, they only became a widespread problem around the halfway mark of the 20th century, when petroleum extraction and production really began to take off. This era also saw the emergence of supertankers, which can transport half a million tons of oil but therefore make the risk of spills even costlier. In fact, the biggest spill off U.S. waters after the Deepwater Horizon disaster is the 1989 Exxon Valdez spill in Alaska, when a tanker crashed into a reef and 11 million gallons of oil spilled into the Pacific Ocean.


