The average U.S. state is made up of 62 counties. With so many counties spread throughout each state in the nation, it’s not surprising that we can find counties that exemplify almost any part of the American experience. In this case, we’re comparing county-level data to look at the differences in economic opportunity within each state. More specifically, we are looking at the range of median household income, which is one proxy for the difference in economic status between counties.
Disparity by State
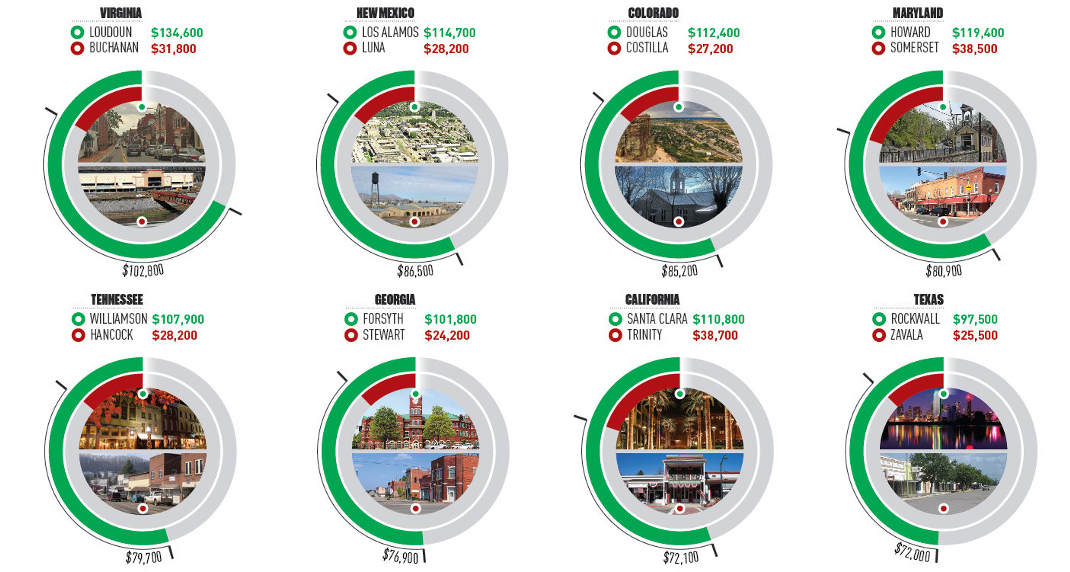
Today’s infographic comes to us from TitleMax, and it looks at the wealthiest and poorest counties in each individual U.S. state based on the measure of median household income. Here are the five states with the biggest disparity between rich and poor counties:
- Virginia: $102,800 Loudoun is about an hour’s drive to D.C., and it also happens to be the richest county in the U.S. in terms of median income. Further west in the state, bordering Kentucky and West Virginia, lies Buchanan County, which has a median household income of just $31,800.
- New Mexico: $86,500 In Los Alamos, known as the birthplace of the atomic bomb, median household income has exploded to $114,700 – meanwhile, along the Mexico border lies Luna, the poorest county in the state.
- Colorado: $85,200 Just like the Colorado has a difference in elevation, it also holds a large difference in median income. Folks in Douglas County, which lies between Denver and Colorado Springs, take home $112,400 in income on average, while folks in Costilla bring in about $27,200 per year.
- Maryland: $80,900 Howard County, which lies between Baltimore and Washington D.C., has the highest median household income in the state. Meanwhile, it’s Somerset County at the south of the Delmarva Peninsula that has the lowest.
- Tennessee: $79,700 Just to the south of the Music City sits Williamson County – a wealthy part of the state with $107,900 in median income. Hancock County is the poorest, and it’s tucked away in the northeast corner of the state.
A Note on Cost of Living
While median household income can help point to disparities between counties, it is just one indicator. It’s worth noting that the cost of living can often be cheaper in counties with lower median incomes, and this can partially offset the difference in some instances. For example, while Trinity County is the poorest county in California by median income, it’s also far away from San Francisco, Los Angeles, or Sacramento, and has a much cheaper cost of living and a different way of life. In some ways it is comparing apples to oranges. Trinity County is completely rural, holds zero incorporated cities, and holds just 3,600 people in its largest community (Weaverville) – a far cry from the urban sprawl of L.A. or the booming Bay Area. on These are in the form of Treasury securities, some of the most liquid assets worldwide. Central banks use them for foreign exchange reserves and private investors flock to them during flights to safety thanks to their perceived low default risk. Beyond these reasons, foreign investors may buy Treasuries as a store of value. They are often used as collateral during certain international trade transactions, or countries can use them to help manage exchange rate policy. For example, countries may buy Treasuries to protect their currency’s exchange rate from speculation. In the above graphic, we show the foreign holders of the U.S. national debt using data from the U.S. Department of the Treasury.
Top Foreign Holders of U.S. Debt
With $1.1 trillion in Treasury holdings, Japan is the largest foreign holder of U.S. debt. Japan surpassed China as the top holder in 2019 as China shed over $250 billion, or 30% of its holdings in four years. This bond offloading by China is the one way the country can manage the yuan’s exchange rate. This is because if it sells dollars, it can buy the yuan when the currency falls. At the same time, China doesn’t solely use the dollar to manage its currency—it now uses a basket of currencies. Here are the countries that hold the most U.S. debt: As the above table shows, the United Kingdom is the third highest holder, at over $655 billion in Treasuries. Across Europe, 13 countries are notable holders of these securities, the highest in any region, followed by Asia-Pacific at 11 different holders. A handful of small nations own a surprising amount of U.S. debt. With a population of 70,000, the Cayman Islands own a towering amount of Treasury bonds to the tune of $284 billion. There are more hedge funds domiciled in the Cayman Islands per capita than any other nation worldwide. In fact, the four smallest nations in the visualization above—Cayman Islands, Bermuda, Bahamas, and Luxembourg—have a combined population of just 1.2 million people, but own a staggering $741 billion in Treasuries.
Interest Rates and Treasury Market Dynamics
Over 2022, foreign demand for Treasuries sank 6% as higher interest rates and a strong U.S. dollar made owning these bonds less profitable. This is because rising interest rates on U.S. debt makes the present value of their future income payments lower. Meanwhile, their prices also fall. As the chart below shows, this drop in demand is a sharp reversal from 2018-2020, when demand jumped as interest rates hovered at historic lows. A similar trend took place in the decade after the 2008-09 financial crisis when U.S. debt holdings effectively tripled from $2 to $6 trillion.
Driving this trend was China’s rapid purchase of Treasuries, which ballooned from $100 billion in 2002 to a peak of $1.3 trillion in 2013. As the country’s exports and output expanded, it sold yuan and bought dollars to help alleviate exchange rate pressure on its currency. Fast-forward to today, and global interest-rate uncertainty—which in turn can impact national currency valuations and therefore demand for Treasuries—continues to be a factor impacting the future direction of foreign U.S. debt holdings.