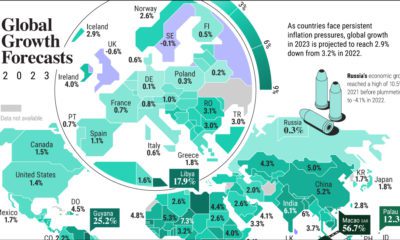
As 2022 clearly illustrated, the global job market can surprise expectations. So far, this year is no different. The unemployment rate in six of the G7 countries hovers near the lowest in a century. With an unemployment rate of 3.4%, the U.S. jobless rate hasn’t fallen this low since 1969. But as some economies navigate a strong labor market against high inflation and hawkish monetary policy, others are facing more challenging conditions. In the above graphic, we map unemployment forecasts in 2023 using data from the IMF’s World Economic Outlook.
Uncertainty Clouds the Surface
Across many countries, the pandemic has made entrenched labor trends worse. It has also altered job market conditions.
South Africa is projected to see the highest jobless rate globally. As the most industrialized nation on the continent, unemployment is estimated to hit 35.6% in 2023. Together, slow economic growth and stringent labor laws have prevented firms from hiring workers. Over the last two decades, unemployment has hovered around 20%.
In Europe, Bosnia and Herzegovina is estimated to see the highest unemployment rate, at over 17%. It is followed by North Macedonia (15.0%) and Spain (12.7%). These jobless rates are more than double the projections for advanced economies in Europe.
The U.S. is forecast to see an unemployment rate of 4.6%, or 1.2% higher than current levels.
This suggests that today’s labor market strength will ease as U.S. economic indicators weaken. One marker is the Conference Board’s Leading Economic Index, which fell for its tenth straight month in December. Lower manufacturing orders, declining consumer expectations, and shorter work weeks are among the indicators it tracks.
Like the U.S., many advanced countries are witnessing labor market strength, especially in the United Kingdom, Asia, and Europe, although how long it will last is unknown.
A Closer Look at U.S. Numbers
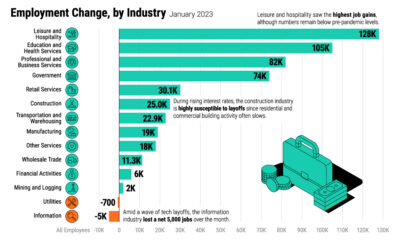
Unlike some declining economic indicators mentioned above, the job market is one of the strongest areas of the global economy. Even as the tech sector reports mass layoffs, unemployment claims in the U.S. fall below recent averages. (It’s worth noting the tech sector makes up just 4% of the workforce). In 2022, 4.8 million jobs were added, more than double the average seen between 2015-2019. Of course, the pandemic recovery has impacted these figures. Some analysts suggest that despite a bleaker economic outlook, companies are hesitant to conduct layoffs. At the same time, the labor market is absorbing workers who have lost employment. Consider the manufacturing sector. Even as the January ISM Purchasing Managers Index posted lower readings, hitting 47.4—a level of 48.7 and below generally indicates a recession—factories are not laying off many workers. Instead, manufacturers are saying they are confident conditions will improve in the second half of the year.
Containing Aftershocks
Today, strong labor markets pose a key challenge for central bankers globally.
This is because the robust job market is contributing to high inflation numbers. Yet despite recent rate increases, the impact has yet to prompt major waves in unemployment. Typically, monetary policy moves like these takes about a year to take peak effect. To combat inflation, monetary policy has been shown to take over three or even four years.
The good news is that inflation can potentially be tamed by other means. Fixing supply-side dynamics, such as preventing supply shortages and improving transportation systems and infrastructure could cool inflation.
As investors closely watch economic data, rising unemployment could come on the heels of higher interest rates, but so far this has yet to unravel.
on
Last year, stock and bond returns tumbled after the Federal Reserve hiked interest rates at the fastest speed in 40 years. It was the first time in decades that both asset classes posted negative annual investment returns in tandem.
Over four decades, this has happened 2.4% of the time across any 12-month rolling period.
To look at how various stock and bond asset allocations have performed over history—and their broader correlations—the above graphic charts their best, worst, and average returns, using data from Vanguard.
How Has Asset Allocation Impacted Returns?
Based on data between 1926 and 2019, the table below looks at the spectrum of market returns of different asset allocations:
We can see that a portfolio made entirely of stocks returned 10.3% on average, the highest across all asset allocations. Of course, this came with wider return variance, hitting an annual low of -43% and a high of 54%.
A traditional 60/40 portfolio—which has lost its luster in recent years as low interest rates have led to lower bond returns—saw an average historical return of 8.8%. As interest rates have climbed in recent years, this may widen its appeal once again as bond returns may rise.
Meanwhile, a 100% bond portfolio averaged 5.3% in annual returns over the period. Bonds typically serve as a hedge against portfolio losses thanks to their typically negative historical correlation to stocks.
A Closer Look at Historical Correlations
To understand how 2022 was an outlier in terms of asset correlations we can look at the graphic below:
The last time stocks and bonds moved together in a negative direction was in 1969. At the time, inflation was accelerating and the Fed was hiking interest rates to cool rising costs. In fact, historically, when inflation surges, stocks and bonds have often moved in similar directions. Underscoring this divergence is real interest rate volatility. When real interest rates are a driving force in the market, as we have seen in the last year, it hurts both stock and bond returns. This is because higher interest rates can reduce the future cash flows of these investments. Adding another layer is the level of risk appetite among investors. When the economic outlook is uncertain and interest rate volatility is high, investors are more likely to take risk off their portfolios and demand higher returns for taking on higher risk. This can push down equity and bond prices. On the other hand, if the economic outlook is positive, investors may be willing to take on more risk, in turn potentially boosting equity prices.
Current Investment Returns in Context
Today, financial markets are seeing sharp swings as the ripple effects of higher interest rates are sinking in. For investors, historical data provides insight on long-term asset allocation trends. Over the last century, cycles of high interest rates have come and gone. Both equity and bond investment returns have been resilient for investors who stay the course.


