This incredible quantity of goods—along with much of what is produced domestically—is handled by the country’s 1.8 million truckers, which represents the 14th most common occupation nationally. To see how these truckers are distributed across the nation, we’ve visualized data from the U.S. Bureau of Labor Statistics (BLS) to create two separate heat maps.
Key Findings from the Data
The relative density of each state’s truckers is measured by their location quotient. This represents the ratio of truckers in a state compared to the national average (both as a % of total employment). For example, if truckers made up 10% of a state’s employment, and the national average was 2%, the location quotient for that state would be 5. This data is listed in the table below. There are four states with a location quotient of two or more: Arkansas, Nebraska, Wyoming, and Iowa. This means that their trucker workforce (as a % of total employment) is at least double the national average. On the other hand, California and New York have some of the lowest location quotients in the country. Trucking companies have been competing fiercely to attract drivers in these areas, but with limited success. To entice more young people to enter the industry, New York recently created a truck driver training program for 18-20 year olds. Some have voiced their concerns about safety, though few alternatives exist. In October 2021, the American Trucking Association (ATA) announced that the national driver shortage had reached a record-breaking 80,000.
A Different Perspective
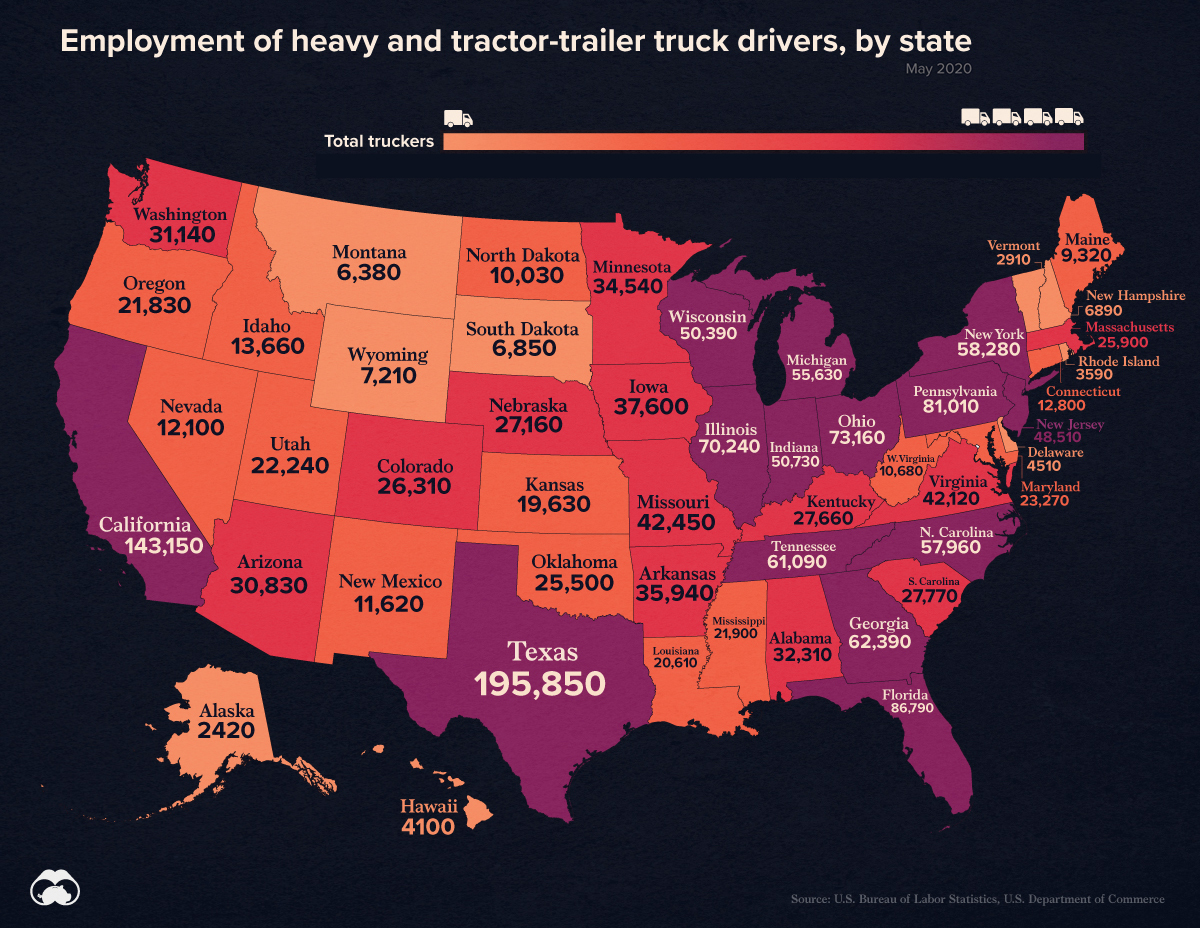
The location quotient is an effective measure because it controls for the differences in each state’s population. Seeing the raw data, though, can still add useful perspective. The following image shows the number of trucker’s in each state. As a reminder, the national total is 1.8 million.
With these numbers, we can gain a more practical understanding of the location quotient. For instance, California has the second highest number of truckers, but it’s dwarfed by the state’s massive population of 40 million.
Occupation Outlook
The BLS expects employment of truck drivers to grow by 6% from 2020 to 2030, which is close to the national average for all jobs. Based on total employment of 1.8 million, this would translate to 108,000 new openings. Whether these openings will be filled is an entirely different story. In the American Trucking Association’s latest report, analysts estimate that the industry will need to recruit 1 million drivers just to replace retiring drivers, or those that leave voluntarily. on Both figures surpassed analyst expectations by a wide margin, and in January, the unemployment rate hit a 53-year low of 3.4%. With the recent release of February’s numbers, unemployment is now reported at a slightly higher 3.6%. A low unemployment rate is a classic sign of a strong economy. However, as this visualization shows, unemployment often reaches a cyclical low point right before a recession materializes.
Reasons for the Trend
In an interview regarding the January jobs data, U.S. Treasury Secretary Janet Yellen made a bold statement: While there’s nothing wrong with this assessment, the trend we’ve highlighted suggests that Yellen may need to backtrack in the near future. So why do recessions tend to begin after unemployment bottoms out?
The Economic Cycle
The economic cycle refers to the economy’s natural tendency to fluctuate between periods of growth and recession. This can be thought of similarly to the four seasons in a year. An economy expands (spring), reaches a peak (summer), begins to contract (fall), then hits a trough (winter). With this in mind, it’s reasonable to assume that a cyclical low in the unemployment rate (peak employment) is simply a sign that the economy has reached a high point.
Monetary Policy
During periods of low unemployment, employers may have a harder time finding workers. This forces them to offer higher wages, which can contribute to inflation. For context, consider the labor shortage that emerged following the COVID-19 pandemic. We can see that U.S. wage growth (represented by a three-month moving average) has climbed substantially, and has held above 6% since March 2022. The Federal Reserve, whose mandate is to ensure price stability, will take measures to prevent inflation from climbing too far. In practice, this involves raising interest rates, which makes borrowing more expensive and dampens economic activity. Companies are less likely to expand, reducing investment and cutting jobs. Consumers, on the other hand, reduce the amount of large purchases they make. Because of these reactions, some believe that aggressive rate hikes by the Fed can either cause a recession, or make them worse. This is supported by recent research, which found that since 1950, central banks have been unable to slow inflation without a recession occurring shortly after.
Politicians Clash With Economists
The Fed has raised interest rates at an unprecedented pace since March 2022 to combat high inflation. More recently, Fed Chairman Jerome Powell warned that interest rates could be raised even higher than originally expected if inflation continues above target. Senator Elizabeth Warren expressed concern that this would cost Americans their jobs, and ultimately, cause a recession. Powell remains committed to bringing down inflation, but with the recent failures of Silicon Valley Bank and Signature Bank, some analysts believe there could be a pause coming in interest rate hikes. Editor’s note: just after publication of this article, it was confirmed that U.S. interest rates were hiked by 25 basis points (bps) by the Federal Reserve.