But it was in 1950 that our thirst for plastic truly began. In just 65 years, plastic production soared almost 200 times, resulting in about 6,300 million metric tons of waste today. How does the world deal with this much debris? The truth is, a lot of plastic waste—both trash and recycled materials—is often shipped overseas to become someone else’s problem.
The Top Exporters and Importers of Plastic Waste
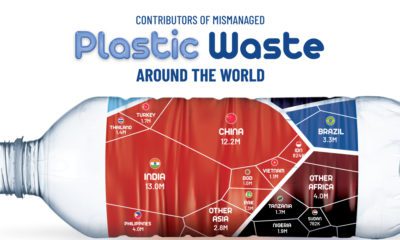
In honor of International Plastic Bag-Free day, today’s graphic uses data from The Guardian to uncover where the world’s plastic waste comes from, and who receives the bulk of these flows. The U.S. could fill up 68,000 shipping containers with its annual plastic waste exports. Put another way, 6,000 blue whales would weigh less than this nearly one million tons of waste exports. Given the amount of plastic which ends up in our oceans, this comparison is just cause for alarm. But one interesting thing to note is that overall totals have halved since 2016:
Top 21 total exports (Jan-Nov 2016): 11,342,439 tons Top 21 total exports (Jan-Nov 2018): 5,828,257 tons Percentage change (2016 to 2018): -49%
The world didn’t suddenly stop producing plastic waste overnight. So what caused the decline?
China Cuts Ties with International Plastic Imports
Over recent years, the trajectory of plastic exports has mimicked the movement of plastic waste into China, including the steep plummet that starts in 2018. After being the world’s dumping ground for decades, China enacted a new policy, dubbed “National Sword”, to ban foreign recyclables. The ban, which includes plastics, has left the world scrambling to find other outlets for its waste. In response, top exporters quickly turned to other countries in Southeast Asia, such as Malaysia, Vietnam, and Thailand. That didn’t completely stop plastic waste from seeping through, though. China previously imported 600,000 tons of plastic monthly, but since the policy only restricted 24 types of solid waste, 30,000 tons per month still entered the country post-ban, primarily from these countries:
🇮🇩 Indonesia: 7,000 tons per month 🇲🇾 Malaysia: 6,000 tons per month 🇺🇸 United States: 5,500 tons per month 🇯🇵 Japan: 4,000 tons per month
Many countries bearing the load of the world’s garbage are planning to follow in China’s footsteps and issue embargoes of their own. What does that mean for the future?
Recycle and Reuse; But Above All, Reduce
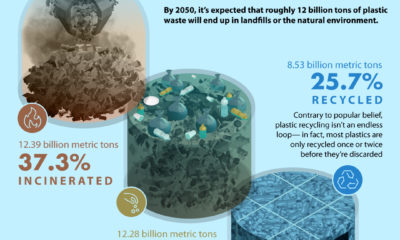
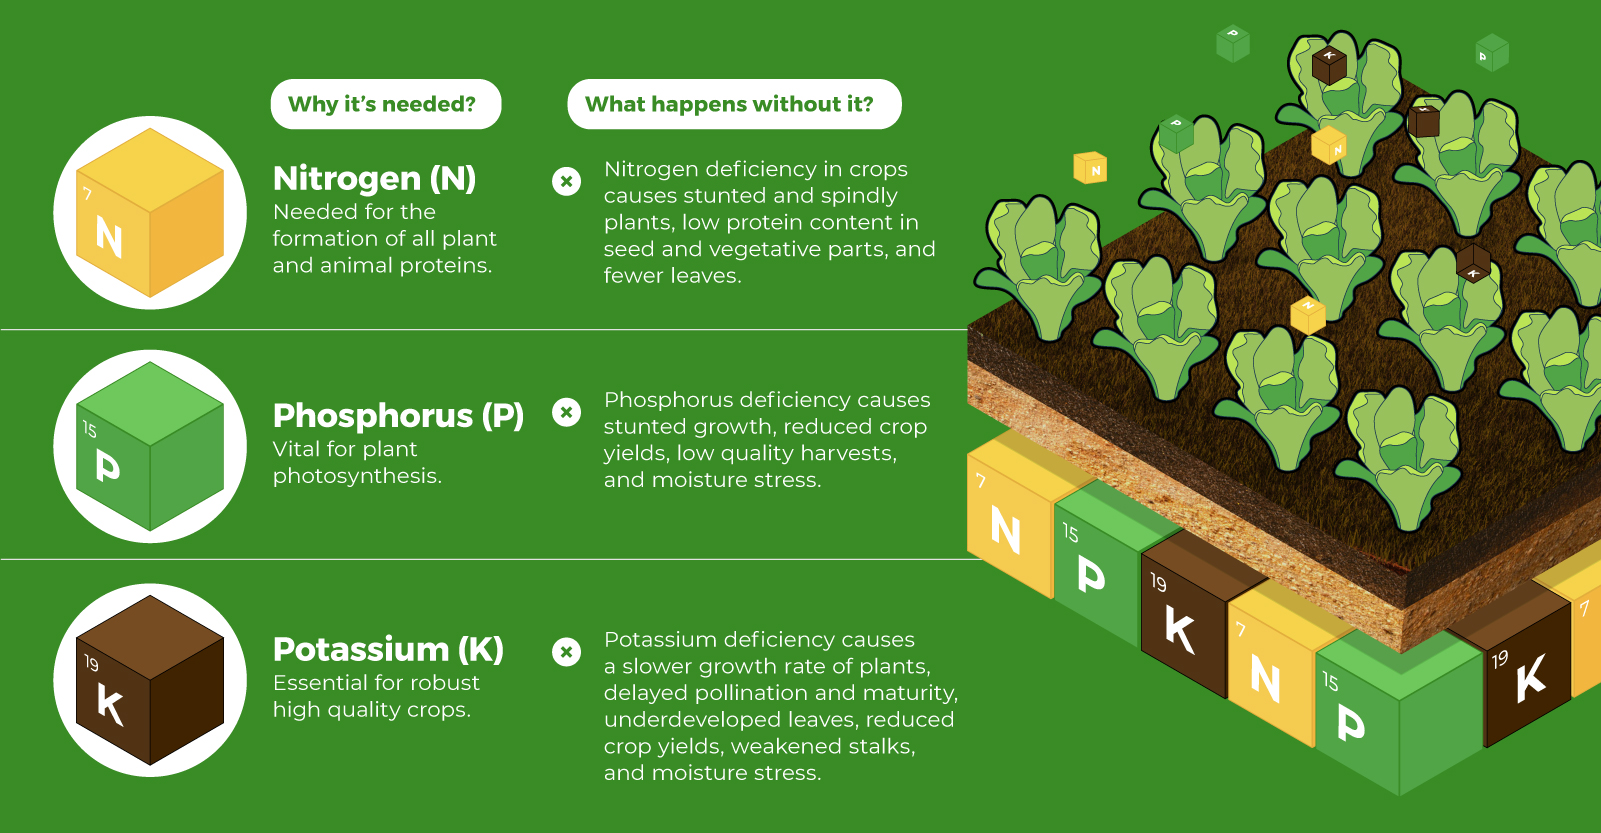
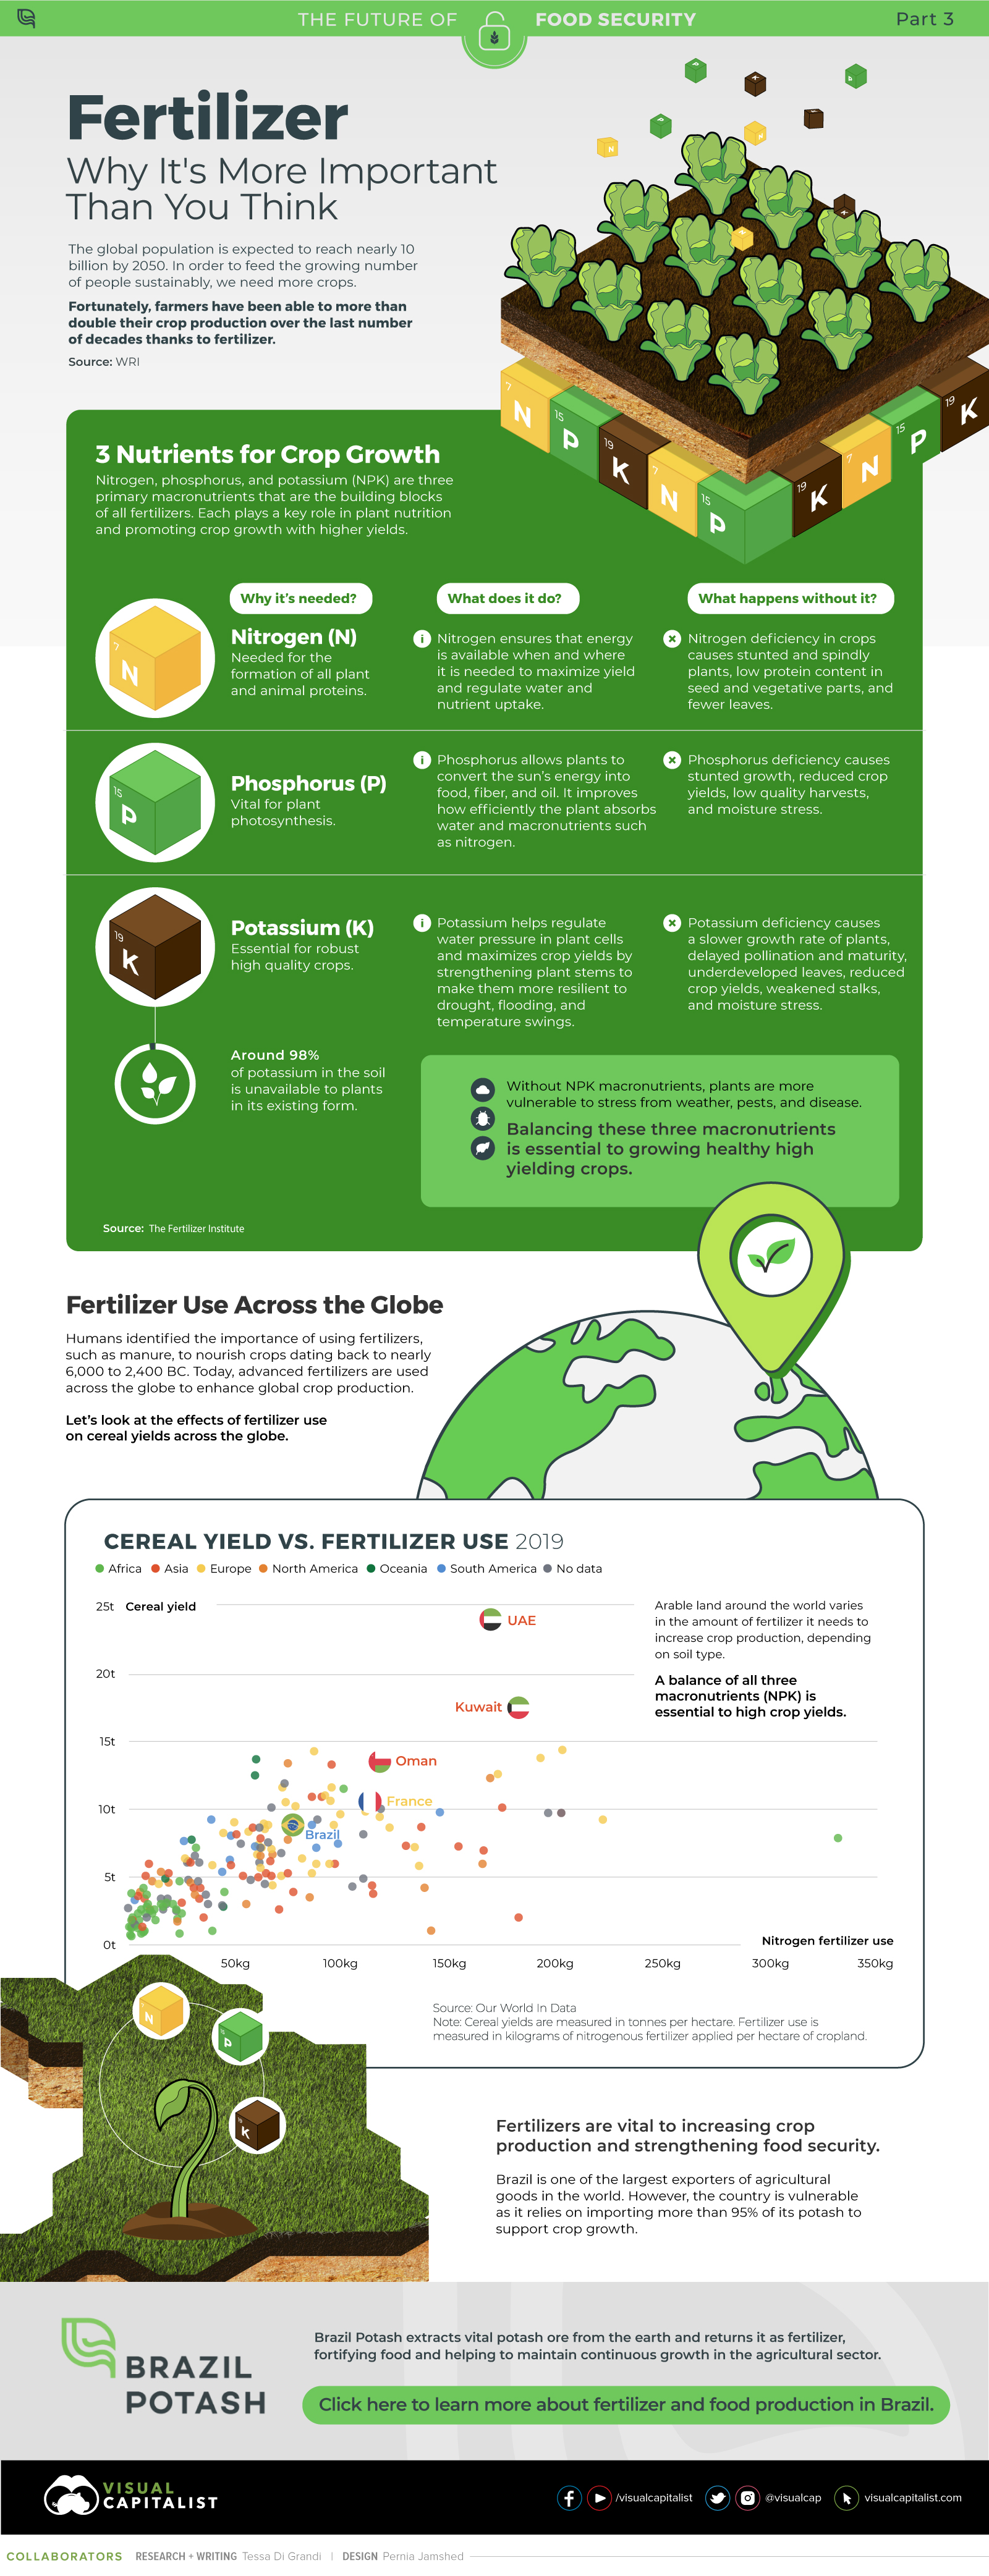
The immense amounts of plastic waste sent overseas include recycled and recyclable materials. That’s because most countries don’t have the means to manage their recycling properly, contrary to public belief. What is being done to mitigate waste in the future? on Over recent decades, farmers have been able to more than double their production of crops thanks to fertilizers and the vital nutrients they contain. When crops are harvested, the essential nutrients are taken away with them to the dining table, resulting in the depletion of these nutrients in the soil. To replenish these nutrients, fertilizers are needed, and the cycle continues. The above infographic by Brazil Potash shows the role that each macronutrient plays in growing healthy, high-yielding crops.
Food for Growth
Nitrogen, phosphorus, and potassium (NPK) are three primary macronutrients that are the building blocks of the global fertilizer industry. Each plays a key role in plant nutrition and promoting crop growth with higher yields. Let’s take a look at how each macronutrient affects plant growth. If crops lack NPK macronutrients, they become vulnerable to various stresses caused by weather conditions, pests, and diseases. Therefore, it is crucial to maintain a balance of all three macronutrients for the production of healthy, high-yielding crops.
The Importance of Fertilizers
Humans identified the importance of using fertilizers, such as manure, to nourish crops dating back to nearly 6,000 to 2,400 BC. As agriculture became more intensive and large-scale, farmers began to experiment with different types of fertilizers. Today advanced chemical fertilizers are used across the globe to enhance global crop production. There are a myriad of factors that affect soil type, and so the farmable land must have a healthy balance of all three macronutrients to support high-yielding, healthy crops. Consequently, arable land around the world varies in the amount and type of fertilizer it needs. Fertilizers play an integral role in strengthening food security, and a supply of locally available fertilizer is needed in supporting global food systems in an ever-growing world. Brazil is one of the largest exporters of agricultural goods in the world. However, the country is vulnerable as it relies on importing more than 95% of its potash to support crop growth. Brazil Potash is developing a new potash project in Brazil to ensure a stable domestic source of this nutrient-rich fertilizer critical for global food security. Click here to learn more about fertilizer and food production in Brazil.