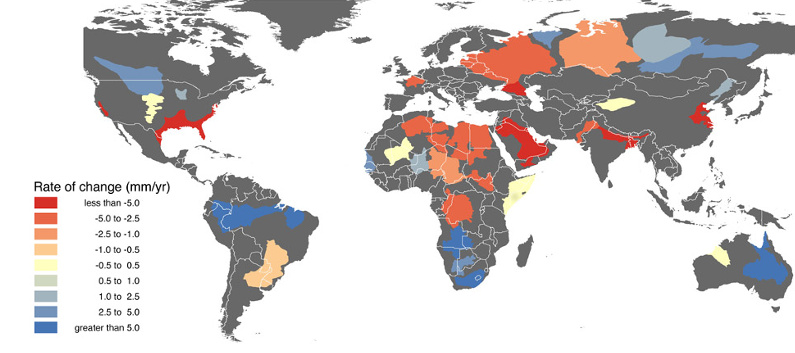
Aquifers are underground layers of water-bearing permeable rock from which groundwater can be extracted with water wells. About 30% of all of the world’s freshwater resources are located in aquifers. Data from NASA’s program was revealed in a recent study, which concluded that 21 of the 37 largest aquifers (57%) are running out too fast to be replenished. Even more concerning: an additional 13 are declining at a rate that puts them in a category NASA calls the “most troubled”. This is putting us closer to peak water territory. In the below map, red shades show negative changes in the water supply in the world’s biggest aquifers.
Trends in Groundwater Storage, 2003-2013
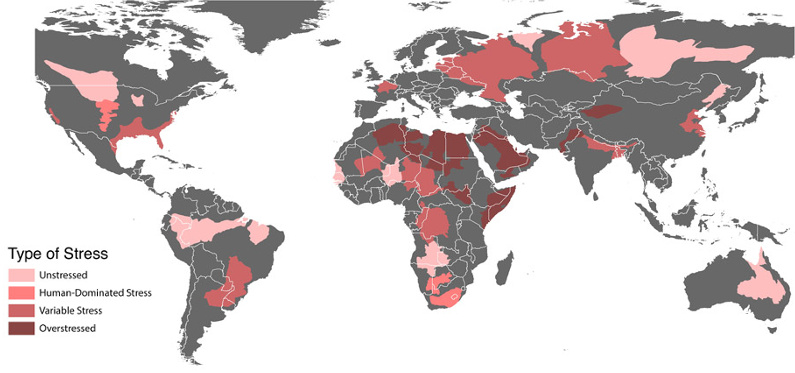
The biggest water sources exert strong gravitational pulls on the satellites, and NASA can use this data to spot trends in water supply while monitoring the world’s largest sources of groundwater. The below map shows the type of stress exhibited on each water source. Overstressed aquifers do not experience any replenishment, while variable stress means that an aquifer is in decline but still experiences some sort of replenishment. Lastly, human-dominated stress means that aquifer levels will not increase unless humans help recharge the wells through irrigation or other methods.
Changes in Storage vs. Aquifer Stress
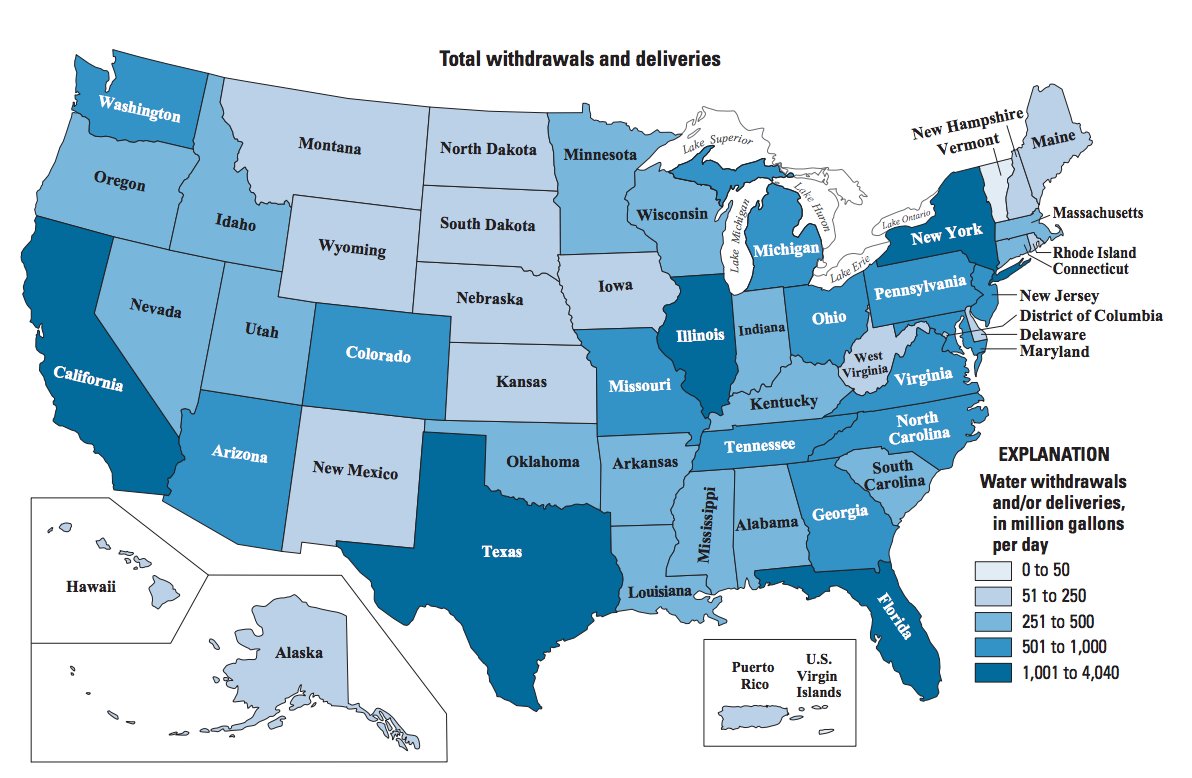
Keep in mind that these are all of the world’s best aquifers, and that changes in smaller groundwater sources are not well reflected in the study. In the United States, it is expected that 40 of 50 states have at least one region that will see some kind of a water shortage in the next 10 years.
California, which is struck by a historical drought, currently relies on 60% of its water from aquifers. For more information on the water challenges faced in the United States, don’t forget to take a look at America’s Water Crisis. Source: Circle of Blue, Business Insider
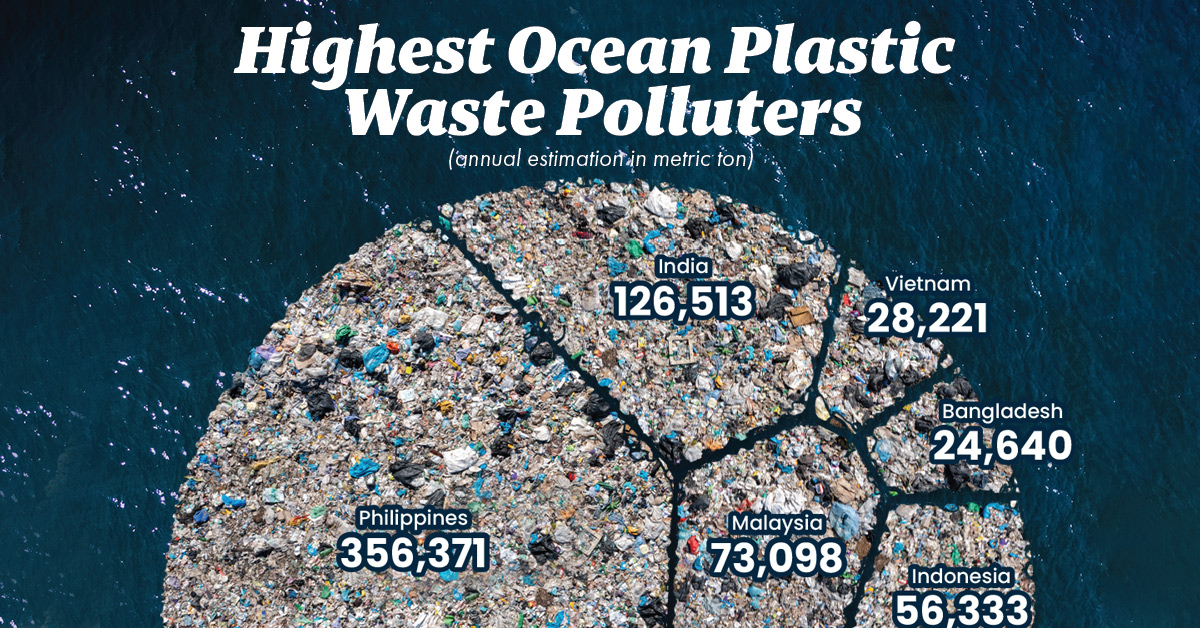
on In fact, many pieces of ocean plastic waste have come together to create a vortex of plastic waste thrice the size of France in the Pacific Ocean between California and Hawaii. Where does all of this plastic come from? In this graphic, Louis Lugas Wicaksono used data from a research paper by Lourens J.J. Meijer and team to highlight the top 10 countries emitting plastic pollutants in the waters surrounding them.
Plastic’s Ocean Voyage
First, let’s talk about how this plastic waste reaches the oceans in the first place. Most of the plastic waste found in the deep blue waters comes from the litter in parks, beaches, or along the storm drains lining our streets. These bits of plastic waste are carried into our drains, streams, and rivers by wind and rainwater runoff. The rivers then turn into plastic superhighways, transporting the plastic to the oceans. A large additional chunk of ocean plastic comes from damaged fishing nets or ghost nets that are directly discarded into the high seas.
Countries Feeding the Plastic Problem
Some might think that the countries producing or consuming the most plastic are the ones that pollute the oceans the most. But that’s not true. According to the study, countries with a smaller geographical area, longer coastlines, high rainfall, and poor waste management systems are more likely to wash plastics into the sea. For example, China generates 10 times the plastic waste that Malaysia does. However, 9% of Malaysia’s total plastic waste is estimated to reach the ocean, in comparison to China’s 0.6%. The Philippines—an archipelago of over 7,000 islands, with a 36,289 kilometer coastline and 4,820 plastic emitting rivers—is estimated to emit 35% of the ocean’s plastic. In addition to the Philippines, over 75% of the accumulated plastic in the ocean is reported to come from the mismanaged waste in Asian countries including India, Malaysia, China, Indonesia, Myanmar, Vietnam, Bangladesh, and Thailand.
The Path to a Plastic-free Ocean
The first, and most obvious, way to reduce plastic accumulation is to reduce the use of plastic. Lesser production equals lesser waste. The second step is managing the plastic waste generated, and this is where the challenge lies. Many high-income countries generate high amounts of plastic waste, but are either better at processing it or exporting it to other countries. Meanwhile, many of the middle-income and low-income countries that both demand plastics and receive bulk exports have yet to develop the infrastructure needed to process it.