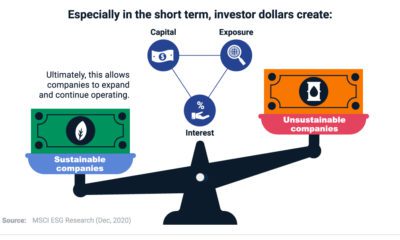
Increasingly, investors are seeing both the financial and social imperative for sustainable investing. In particular, the rapid growth of green bonds—a fixed income investment that is designed to raise funds for the climate or environment—is booming.
The above infographic from Raconteur navigates the growing green bond market against the backdrop of the broader ESG (environmental, social, and governance) investing shift.
Gathering Steam
By the end of 2020, $45 trillion in assets will adhere to sustainable practices, including ESG principles. Despite the loss of confidence from COVID-19, investors flocked to sustainable-focused funds.In fact, global fund flows hit record levels for Q2 of 2020—surpassing $71 billion. The fund flows are not without financial warrant. Between April 2015 and April 2019, average returns of socially responsible investments (SRI) outperformed their non-SRI peers. At the same time, 94% of sustainable indices realized stronger returns than their benchmarks between January and March 2020. The accelerating demand for sustainable investments may seem like old news, but green bonds offer a new avenue.
What Are Green Bonds?
Green bonds raise money for climate and environmental projects, and are issued by governments, corporations, and financial institutions. Multilateral development banks, which include the European Investment Bank and the World Bank, initially brought them to market in 2007, though they had a slow start. However, in 2019, new issues of green bonds topped $258 billion worldwide—jumping 51% in one year. Across the green bond market there is a broad spectrum of different debt instruments. These include private placements, covered bonds, and green loans. Green private placements occur when the sale of bonds are made to private investors, rather than through public offerings. Green covered bonds, on the other hand, are bonds that are backed by a group of assets that are sustainably-focused. Green loans are forms of loans that are meant to finance green projects. Overall, green bonds can be diversified across a number of different sectors.
The Top Purposes for Green Bonds
What are the top sectors for green bond issuance?
Source: MSCI
Alternative energy, accounting for over $143 billion in green bonds, outpaces all other sectors by a wide margin. Within four years, renewable energy bond issuance has more than quadrupled.
Meanwhile, green building bonds are garnering attention. These instruments finance the construction of energy efficient buildings. Within the industry, a notable green building certification system is the LEED standard, also internationally recognized. Often, real estate investment trusts (REITs) are involved in issuing green building bonds.
Interestingly, Big Tech is also becoming more active within the green bond landscape. Google’s parent company, Alphabet, has issued a record $5.8 billion in corporate sustainability bonds to fund everything from energy efficiency projects to affordable housing.
The Top 10 Countries for Green Bonds
On a country-by-country level, green bonds are most common in the U.S., China, and France. Source: Climate Bonds Initiative Germany issued its first multi-billion dollar government green bonds in just 2019. One catalyst behind this was the European Central Bank’s announcement that the environment would become a “mission critical” priority going forward. This may contribute to the fact that both Germany and France saw the biggest change between 2018 and 2019.
Opening the Floodgates
As sustainable investing becomes front and center on the global agenda, questions about its impact on returns have arisen. During times of both extreme exuberance and market crisis, companies with higher sustainability ratings have outperformed their respective benchmark. However, there is still a long way to go. Even with the record issuance of green bonds in 2019, they make up just 3% of all global bonds issued. As demand for sustainable investments quickly grows, could it spell a watershed decade ahead for green bonds? on Last year, stock and bond returns tumbled after the Federal Reserve hiked interest rates at the fastest speed in 40 years. It was the first time in decades that both asset classes posted negative annual investment returns in tandem. Over four decades, this has happened 2.4% of the time across any 12-month rolling period. To look at how various stock and bond asset allocations have performed over history—and their broader correlations—the above graphic charts their best, worst, and average returns, using data from Vanguard.
How Has Asset Allocation Impacted Returns?
Based on data between 1926 and 2019, the table below looks at the spectrum of market returns of different asset allocations:
We can see that a portfolio made entirely of stocks returned 10.3% on average, the highest across all asset allocations. Of course, this came with wider return variance, hitting an annual low of -43% and a high of 54%.
A traditional 60/40 portfolio—which has lost its luster in recent years as low interest rates have led to lower bond returns—saw an average historical return of 8.8%. As interest rates have climbed in recent years, this may widen its appeal once again as bond returns may rise.
Meanwhile, a 100% bond portfolio averaged 5.3% in annual returns over the period. Bonds typically serve as a hedge against portfolio losses thanks to their typically negative historical correlation to stocks.
A Closer Look at Historical Correlations
To understand how 2022 was an outlier in terms of asset correlations we can look at the graphic below:
The last time stocks and bonds moved together in a negative direction was in 1969. At the time, inflation was accelerating and the Fed was hiking interest rates to cool rising costs. In fact, historically, when inflation surges, stocks and bonds have often moved in similar directions. Underscoring this divergence is real interest rate volatility. When real interest rates are a driving force in the market, as we have seen in the last year, it hurts both stock and bond returns. This is because higher interest rates can reduce the future cash flows of these investments. Adding another layer is the level of risk appetite among investors. When the economic outlook is uncertain and interest rate volatility is high, investors are more likely to take risk off their portfolios and demand higher returns for taking on higher risk. This can push down equity and bond prices. On the other hand, if the economic outlook is positive, investors may be willing to take on more risk, in turn potentially boosting equity prices.
Current Investment Returns in Context
Today, financial markets are seeing sharp swings as the ripple effects of higher interest rates are sinking in. For investors, historical data provides insight on long-term asset allocation trends. Over the last century, cycles of high interest rates have come and gone. Both equity and bond investment returns have been resilient for investors who stay the course.