During the initial stages of the pandemic, when panic and uncertainty ran rife, BEACH stocks–booking, entertainment, airlines, cruises, and hotels—were left scrambling. Collectively, $332 billion in market cap washed away. Now, it appears the tide might be turning for these companies, buoyed by vaccine breakthroughs and glimmers of hope for a return to normalcy. This infographic looks at the growth in market cap value across BEACH stocks one year from when the WHO officially declared COVID-19 a pandemic.
Washing Back to Shore?
BEACH stocks have gained a collective $376 billion in market cap in the year since the pandemic was declared, with about half the companies trading at their respective all-time highs. In fact, about 70% of BEACH stocks have actually outperformed the S&P 500, which returned 43.7% during the same period.
BEACH Stocks Leaders and Laggards
When dissecting this basket of stocks by industry, it’s clear that much of the recovery story is lopsided. One reason for this, despite the pandemic, is that there are more granular, idiosyncratic trends occurring within these sectors. Let’s look at what’s propelling the leaders, and dragging down the laggards:
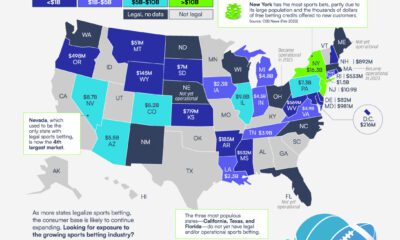
Leading: Online Betting
There’s reason to be bullish on gambling stocks. Since late 2018, some 20 states have legalized sports betting, with more expecting to follow. Relative to other areas, the pandemic has been kind to gambling stocks. Many of those with an online presence have witnessed a spike in traffic, as more people continue to flock towards online betting. Within the BEACH stocks basket, Penn National Gaming and Caesars Entertainment are clear outliers, having grown an epic 661% and 823% respectively. In addition, the broader industry (measured by the BETZ ETF) has nearly doubled the performance of the S&P 500 since its inception.
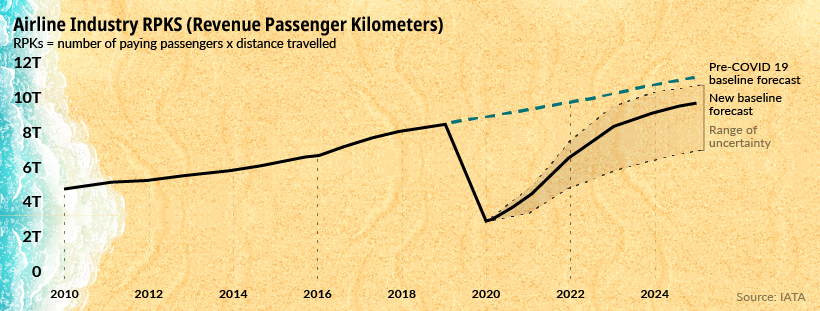
Laggard: Airlines
The return to normalcy will be much more delayed for airlines. Global RPKs, an industry metric, are not expected to reach pre-pandemic levels until 2024. Actions of insiders also seem to match this negative sentiment. Warren Buffett, once a staunch supporter of airlines, decided to call it quits during the pandemic—dumping his entire position.
U.S. airline executives have collectively been selling their stakes much more aggressively than in the last few years. To add insult to injury, there’s significant shorting of airline stocks as well. At a short interest of 11.6%, American Airlines is most heavily shorted BEACH stock.
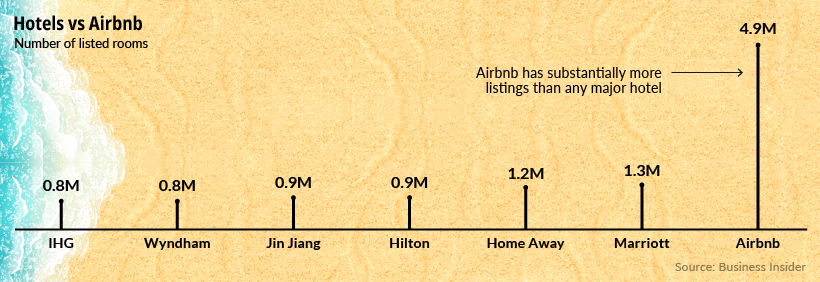
Laggard: Hotels
In a year where social interactions and gatherings have largely disappeared, so too has much of the business activity for hotels. For instance, Hilton sales suffered a 58% decline year-over-year. But even without the pandemic, the hotel industry had their work cut out for them, through a growing and formidable competitor in Airbnb. Airbnb can scale its network beyond what any hotel can. This is evident in its room count, which is greater than the largest hotels combined.
More Bumps On The Road Ahead?
The investing landscape today looks to be disconnected from reality, in part because of the forward-looking nature of markets. Even though things are dire today, there’s a belief that light exists at the end of the tunnel. But the path to recovery isn’t quite so linear. When the dust settles, it’ll become more apparent which industries will “return to normal” and which have set out permanently on a new trajectory. on Last year, stock and bond returns tumbled after the Federal Reserve hiked interest rates at the fastest speed in 40 years. It was the first time in decades that both asset classes posted negative annual investment returns in tandem. Over four decades, this has happened 2.4% of the time across any 12-month rolling period. To look at how various stock and bond asset allocations have performed over history—and their broader correlations—the above graphic charts their best, worst, and average returns, using data from Vanguard.
How Has Asset Allocation Impacted Returns?
Based on data between 1926 and 2019, the table below looks at the spectrum of market returns of different asset allocations:
We can see that a portfolio made entirely of stocks returned 10.3% on average, the highest across all asset allocations. Of course, this came with wider return variance, hitting an annual low of -43% and a high of 54%.
A traditional 60/40 portfolio—which has lost its luster in recent years as low interest rates have led to lower bond returns—saw an average historical return of 8.8%. As interest rates have climbed in recent years, this may widen its appeal once again as bond returns may rise.
Meanwhile, a 100% bond portfolio averaged 5.3% in annual returns over the period. Bonds typically serve as a hedge against portfolio losses thanks to their typically negative historical correlation to stocks.
A Closer Look at Historical Correlations
To understand how 2022 was an outlier in terms of asset correlations we can look at the graphic below:
The last time stocks and bonds moved together in a negative direction was in 1969. At the time, inflation was accelerating and the Fed was hiking interest rates to cool rising costs. In fact, historically, when inflation surges, stocks and bonds have often moved in similar directions. Underscoring this divergence is real interest rate volatility. When real interest rates are a driving force in the market, as we have seen in the last year, it hurts both stock and bond returns. This is because higher interest rates can reduce the future cash flows of these investments. Adding another layer is the level of risk appetite among investors. When the economic outlook is uncertain and interest rate volatility is high, investors are more likely to take risk off their portfolios and demand higher returns for taking on higher risk. This can push down equity and bond prices. On the other hand, if the economic outlook is positive, investors may be willing to take on more risk, in turn potentially boosting equity prices.
Current Investment Returns in Context
Today, financial markets are seeing sharp swings as the ripple effects of higher interest rates are sinking in. For investors, historical data provides insight on long-term asset allocation trends. Over the last century, cycles of high interest rates have come and gone. Both equity and bond investment returns have been resilient for investors who stay the course.